
Best 12+ Tools for Data Analysis in 2026
Last Updated: October 16, 2025
Raw numbers rarely tell a clear story on their own. Data Analysis tools help identify the patterns, trends, and insights buried in a dataset, ranging from simple spreadsheet analysis to more advanced statistical and visualization tools.
This is essential for business analysts, marketers, and researchers who need to turn raw data into an actual decision, rather than relying on guesswork.
 Heap
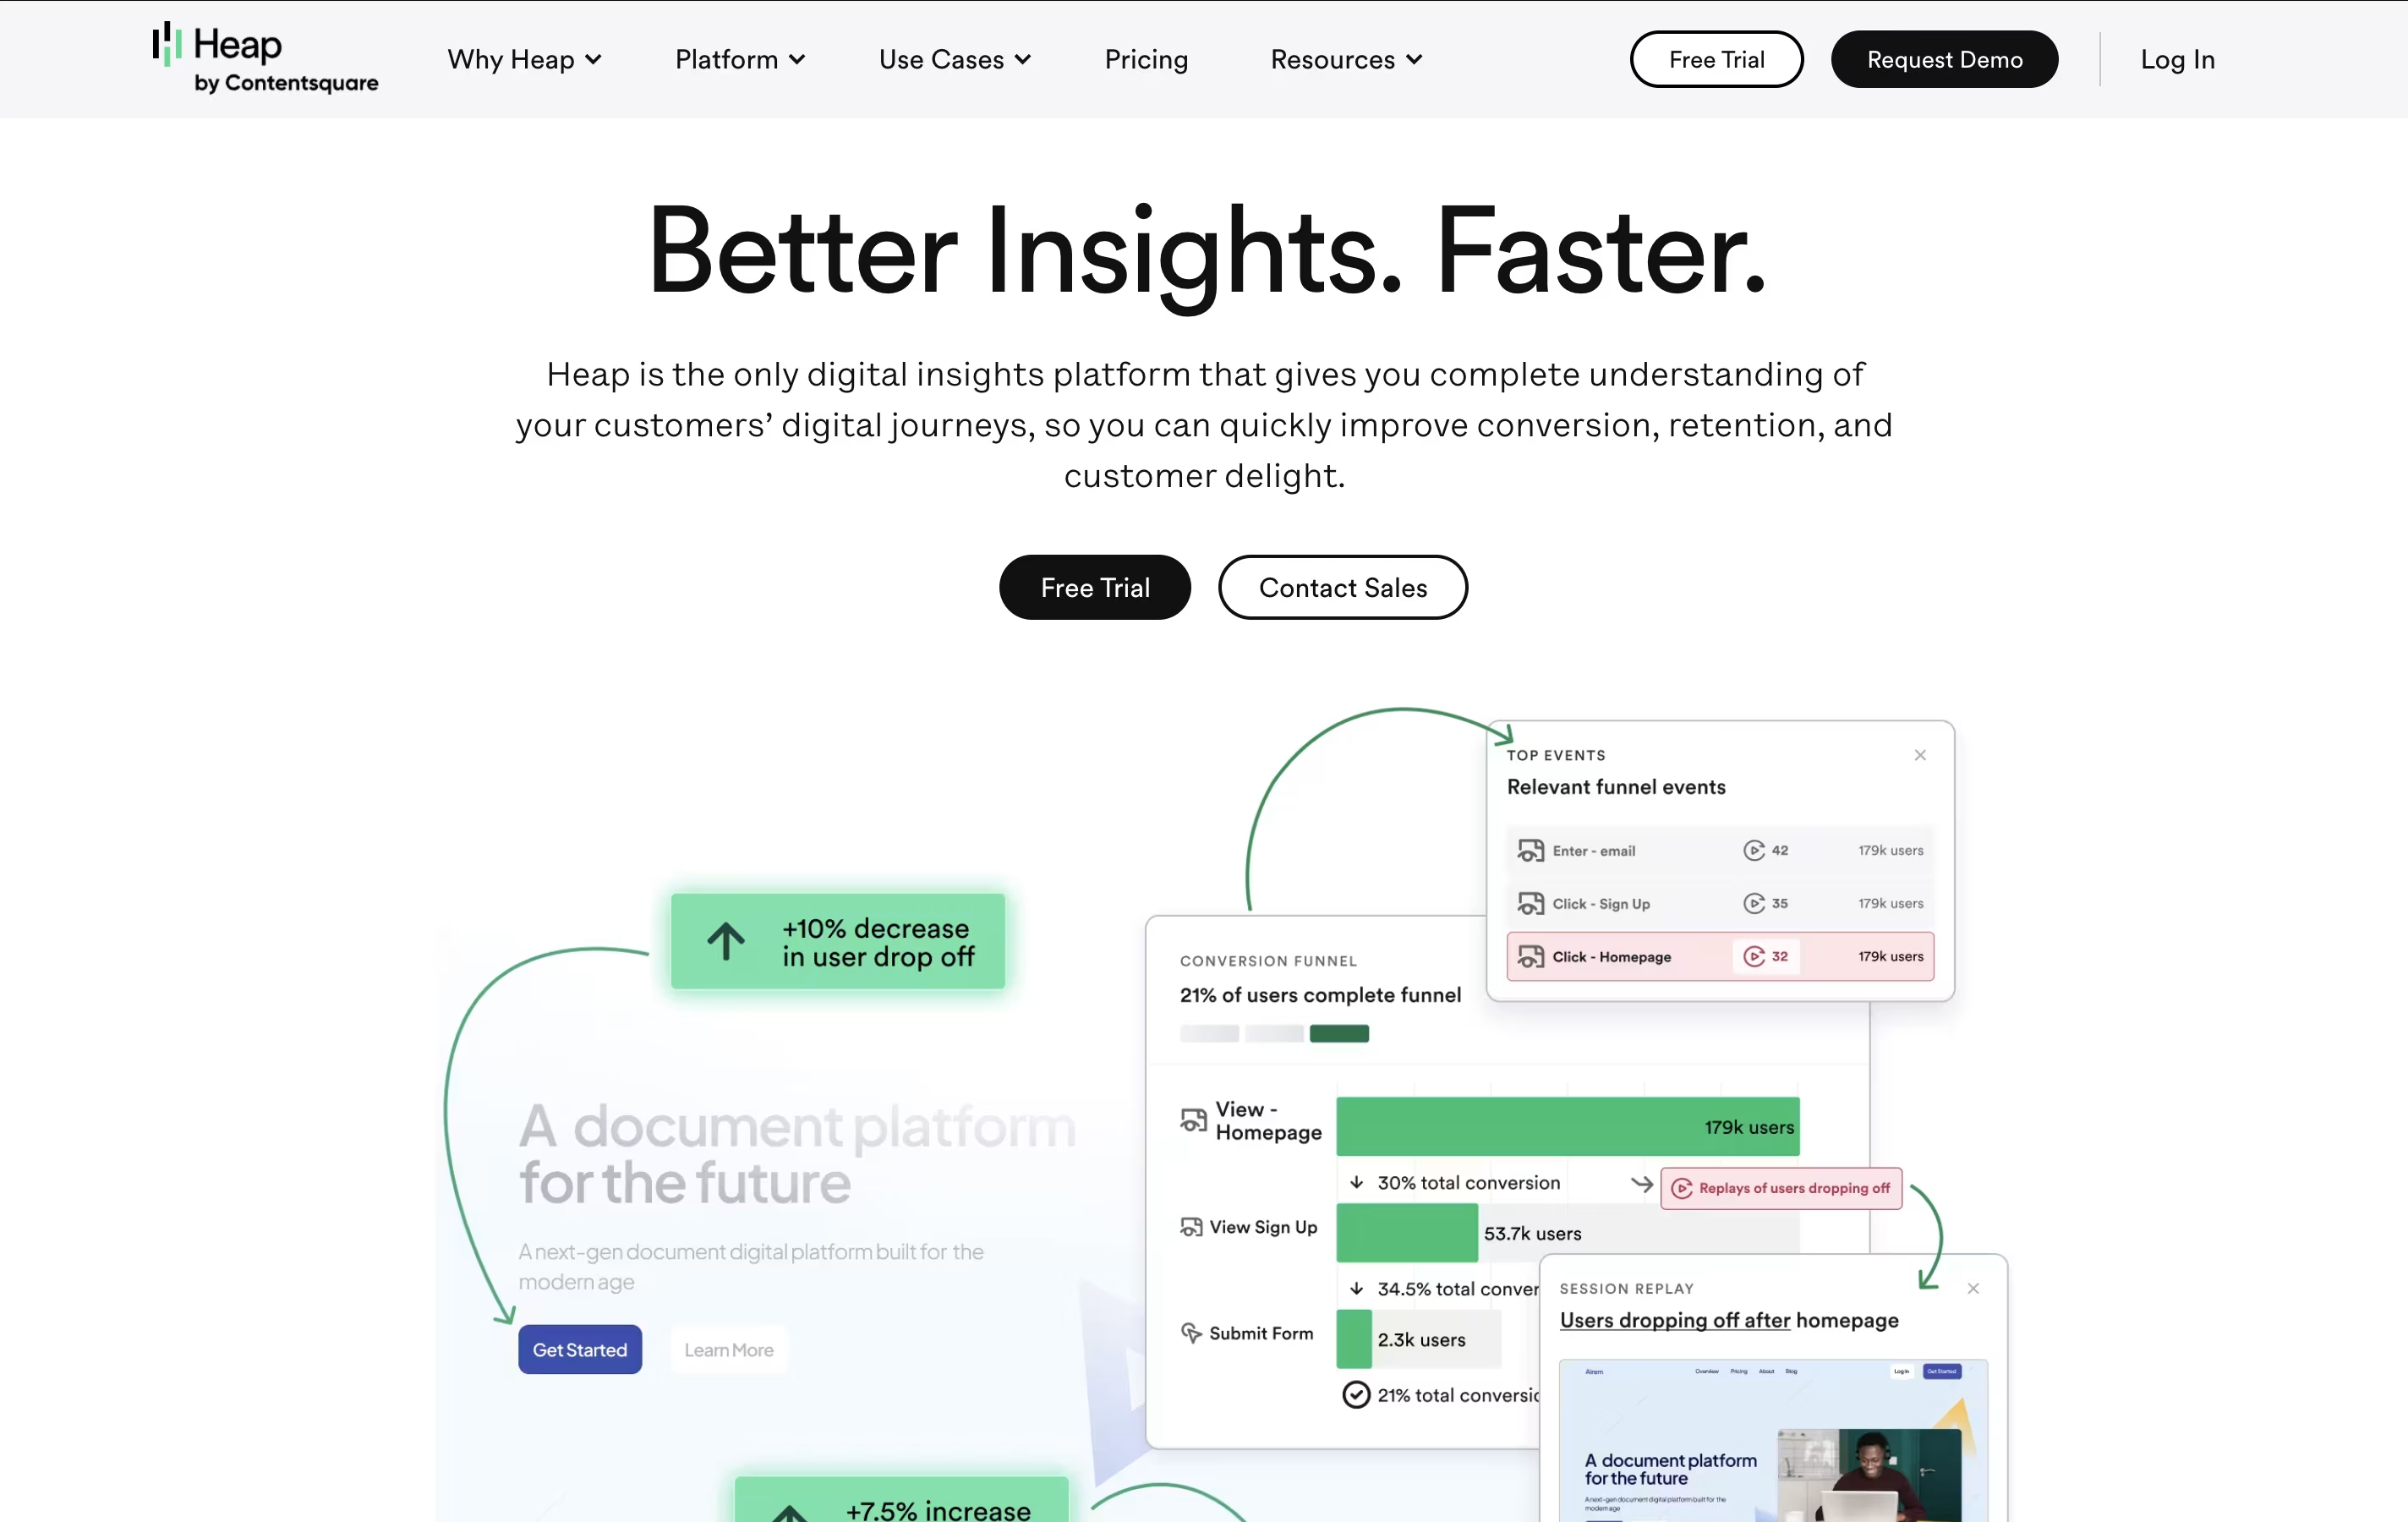 HeapAutomatic User Analytics Platform for Better Digital Experiences,
 Usermaven
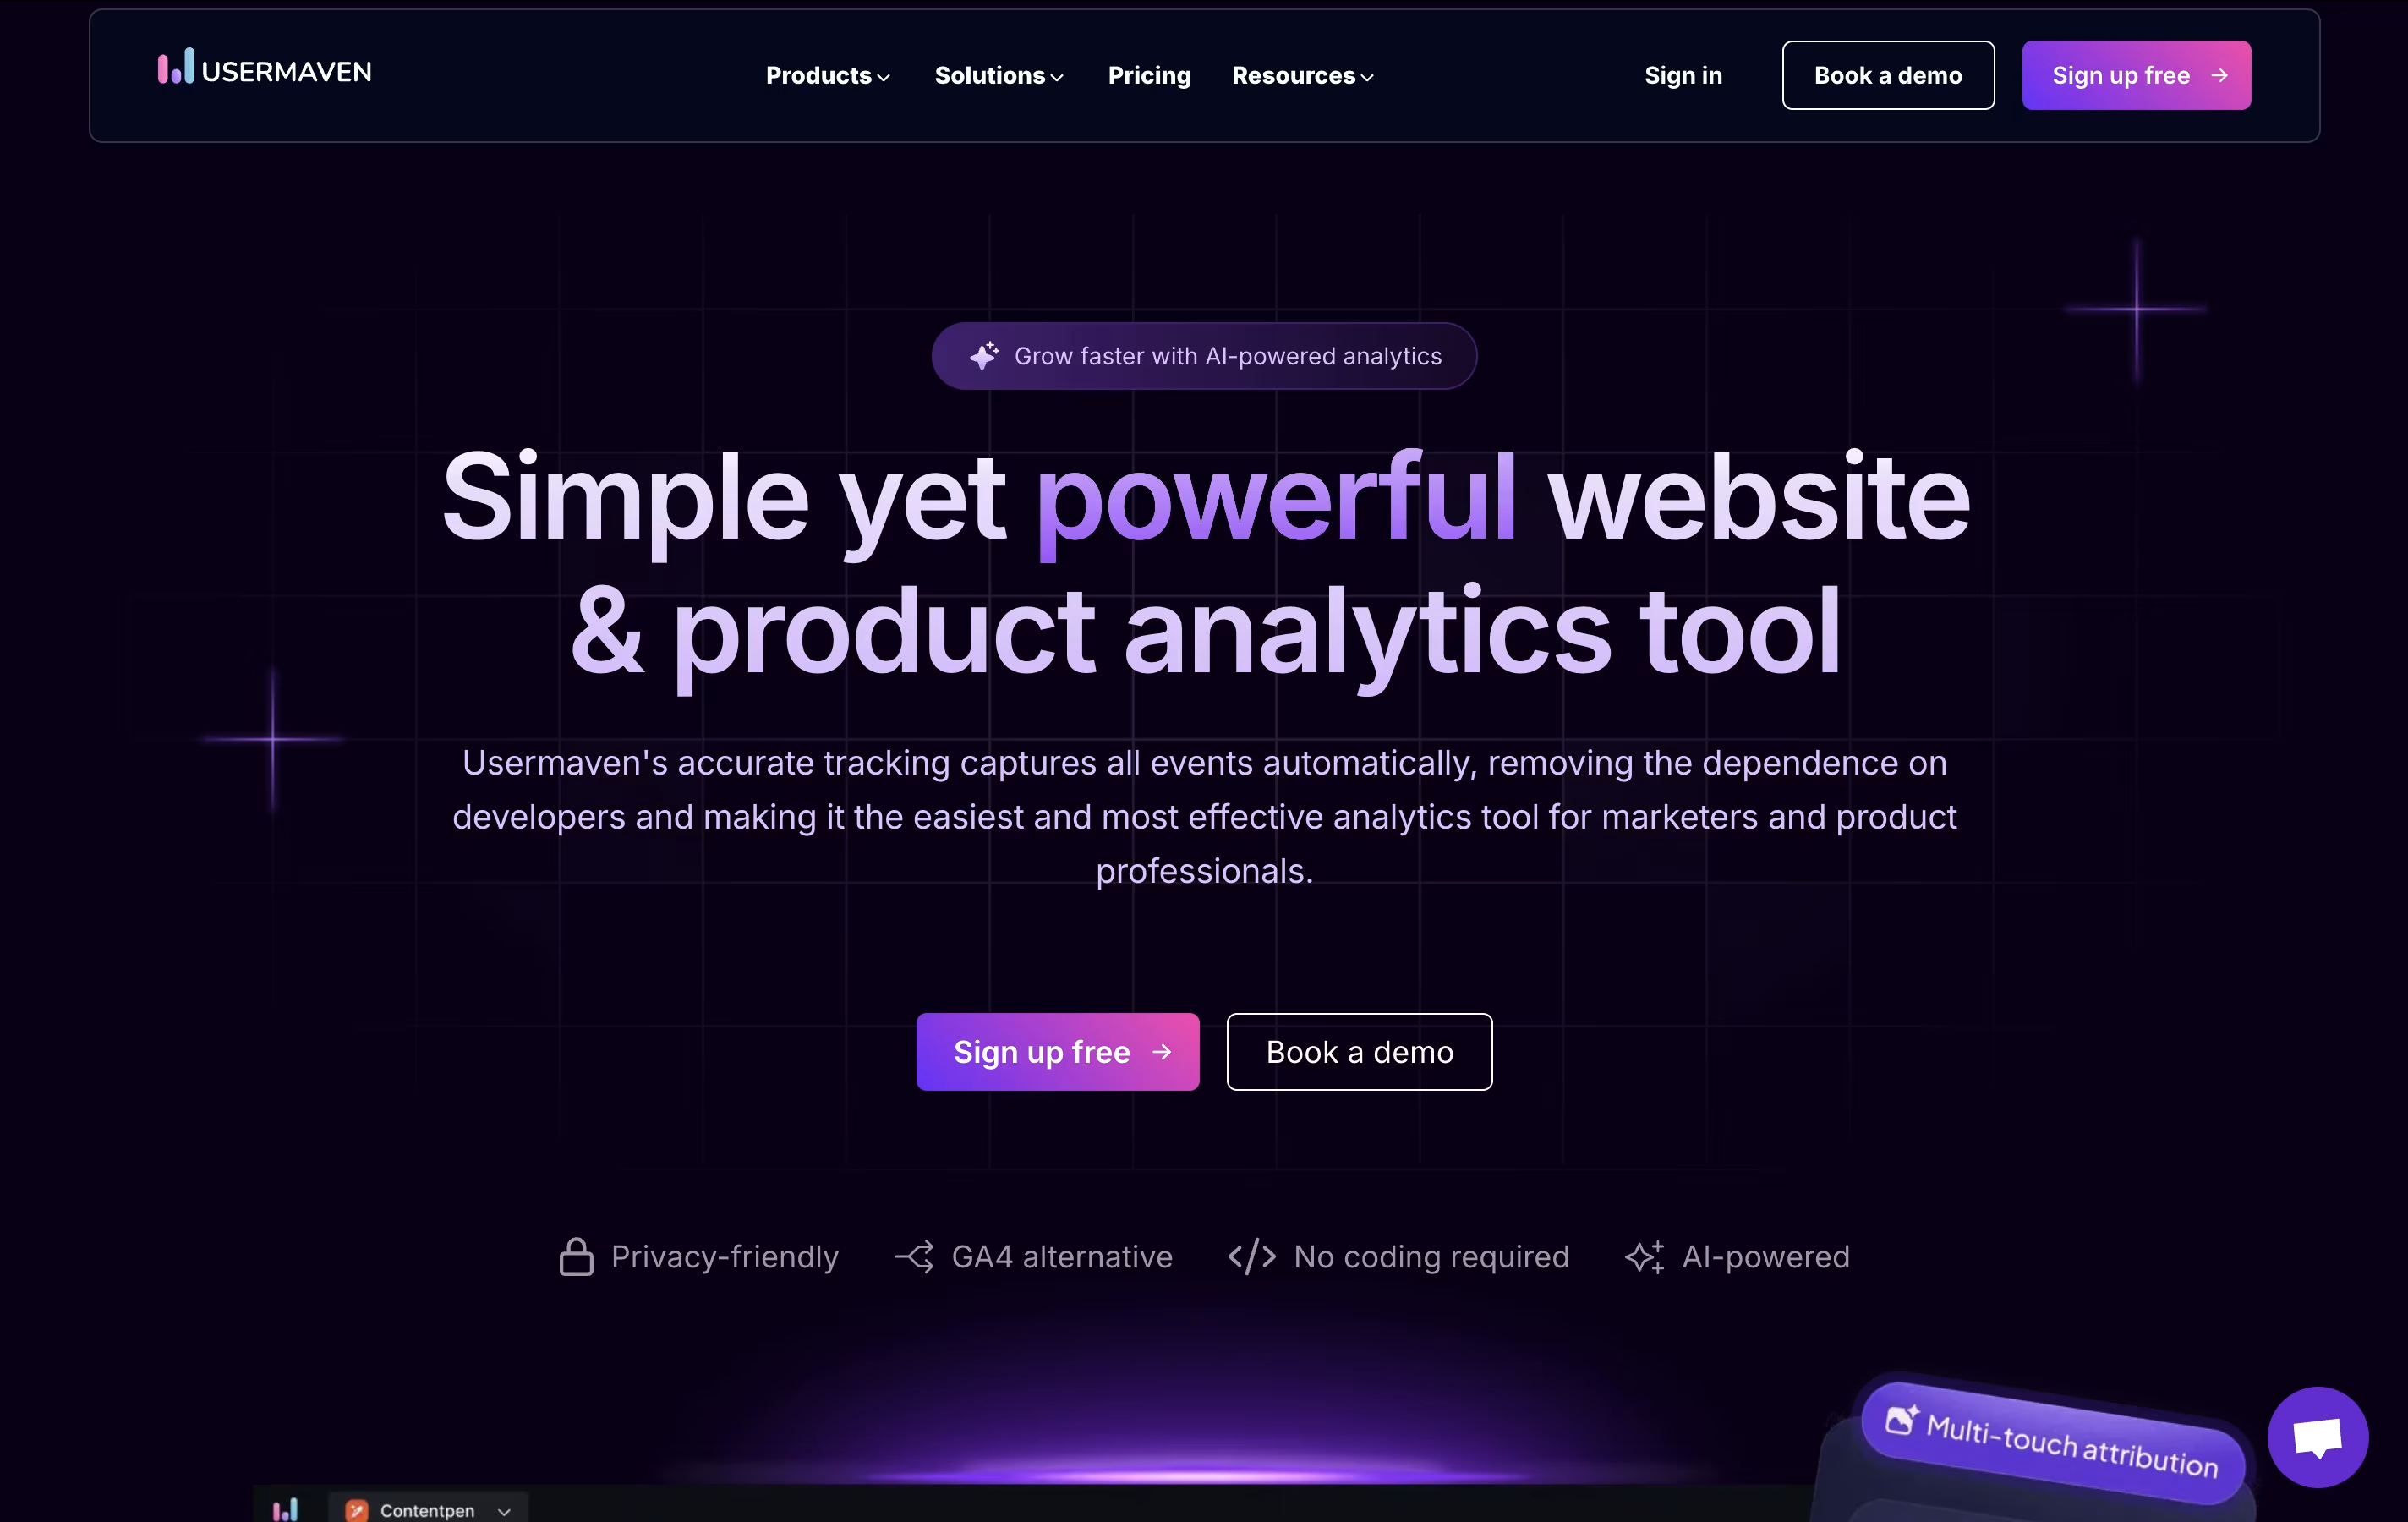 UsermavenSimple Privacy-Friendly Analytics Platform, and
 Lumenore
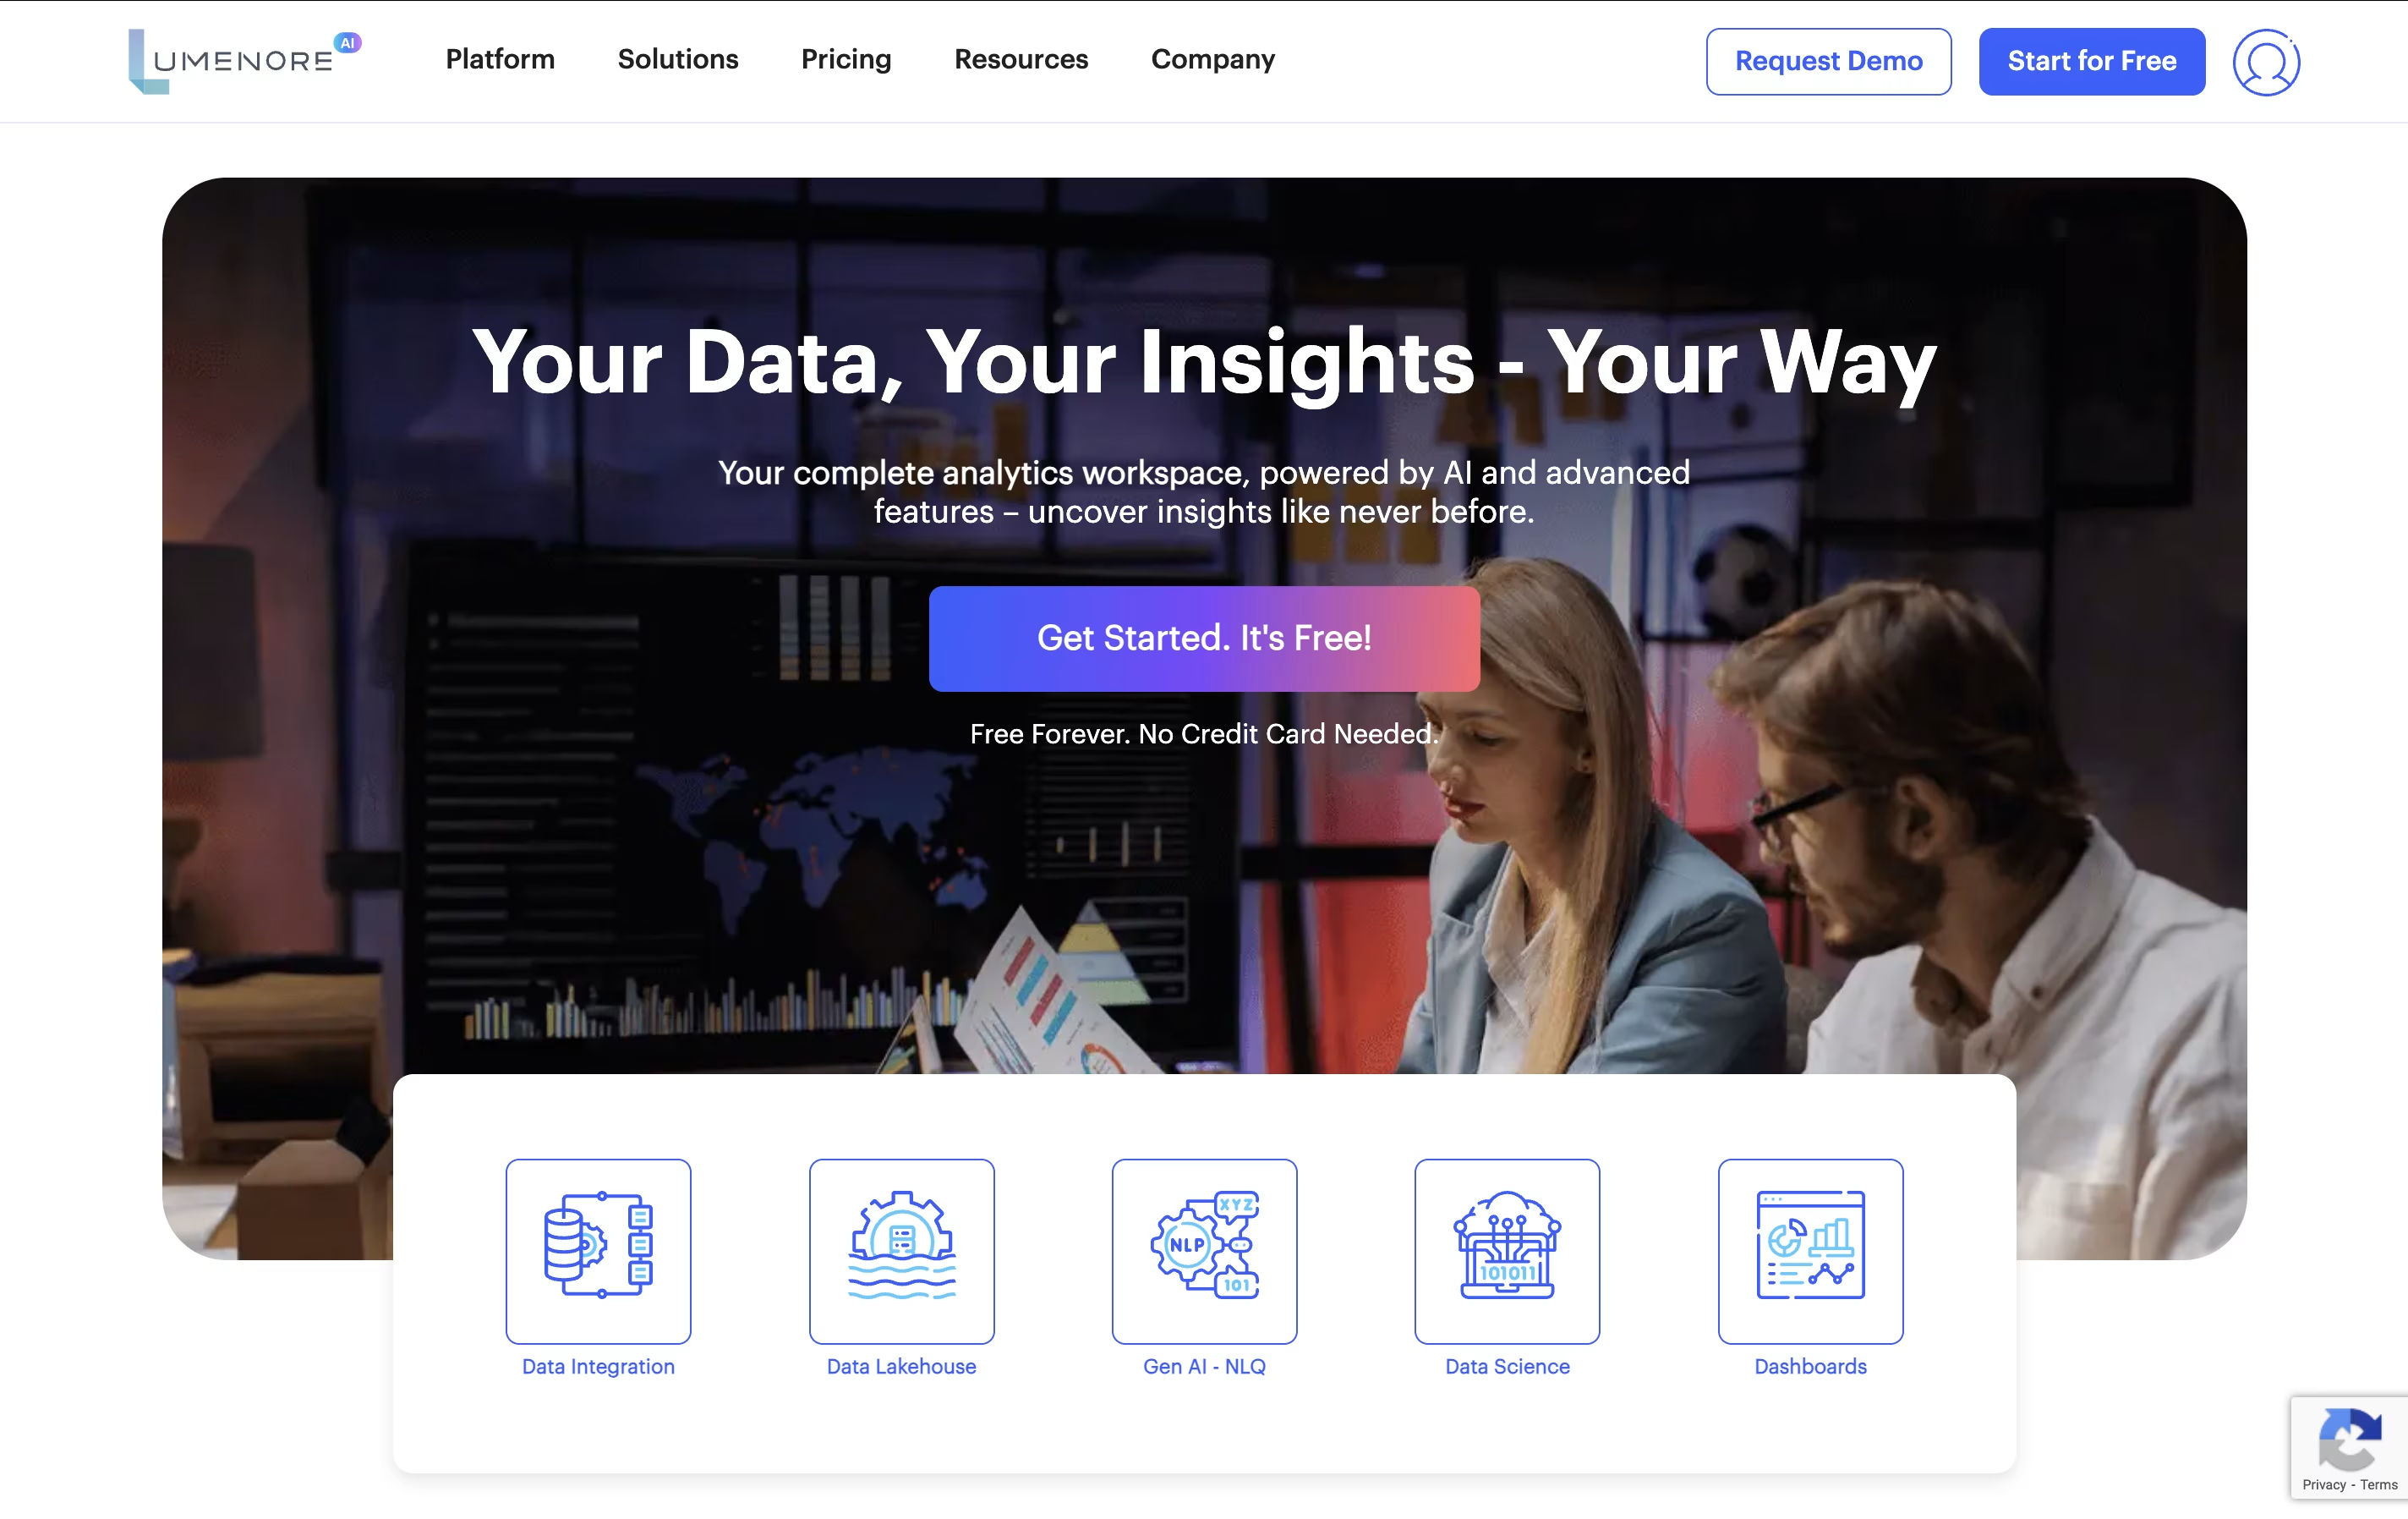 LumenoreAI Business Intelligence Platform for Data Analytics are the best for Data Analysis. So, let’s take a closer look at all 12+ tools.
Heap is a product analytics tool that automatically tracks and analyzes user behavior on websites and mobile applications. Unlike traditional analytics platforms that require manual setup for each event you want to track, Heap captures everything automatically from the moment you install its code snippet.
The platform provides features like funnel analysis, session replay, user journey mapping, and conversion tracking. You can see exactly how users navigate through your product, where they encounter friction, and what leads to successful conversions. Heap also offers retroactive analysis, meaning you can analyze historical data for events you didn't initially plan to track.
This makes it particularly valuable for product managers, marketers, and UX designers who need comprehensive insights into user behavior to optimize their digital experiences.
Usermaven is a privacy-focused analytics platform that provides both website analytics and product analytics in one simple tool. Founded in 2021, this cloud-based solution serves as a smart alternative to Google Analytics, focusing on ease of use and privacy compliance.
The platform automatically captures user interactions like clicks, form submissions, and page visits without requiring any coding knowledge. What makes Usermaven special is its commitment to privacy – it offers cookieless tracking, hosts data in EU servers, and fully complies with GDPR and CCPA regulations.
Usermaven combines the power of advanced analytics with AI-driven insights to help businesses understand user behavior, track marketing campaigns, and improve product adoption. The tool serves everyone from small business owners to large enterprises, providing clear, actionable data that helps make better business decisions without compromising user privacy.
Lumenore is a complete business intelligence platform that helps companies analyze their data using artificial intelligence. Unlike traditional analytics tools that require technical expertise, Lumenore works with simple, everyday language. You can ask questions like "What are my top-selling products?" and get instant visual answers.
The platform connects to over 50 different data sources, including databases, spreadsheets, and popular business tools. It creates a single place where all your company data comes together. The AI engine, called "Do You Know," automatically finds patterns, trends, and unusual changes in your data. It also predicts future outcomes to help with planning. With customizable dashboards and easy-to-understand charts, anyone in your organization can access insights and make data-driven decisions quickly.

Mitzu is a warehouse-native product analytics platform designed specifically for businesses that want to analyze their data without the complexity and costs of traditional analytics tools. Think of it as a smart layer that sits on top of your existing data warehouse, automatically generating SQL queries based on your questions and needs.
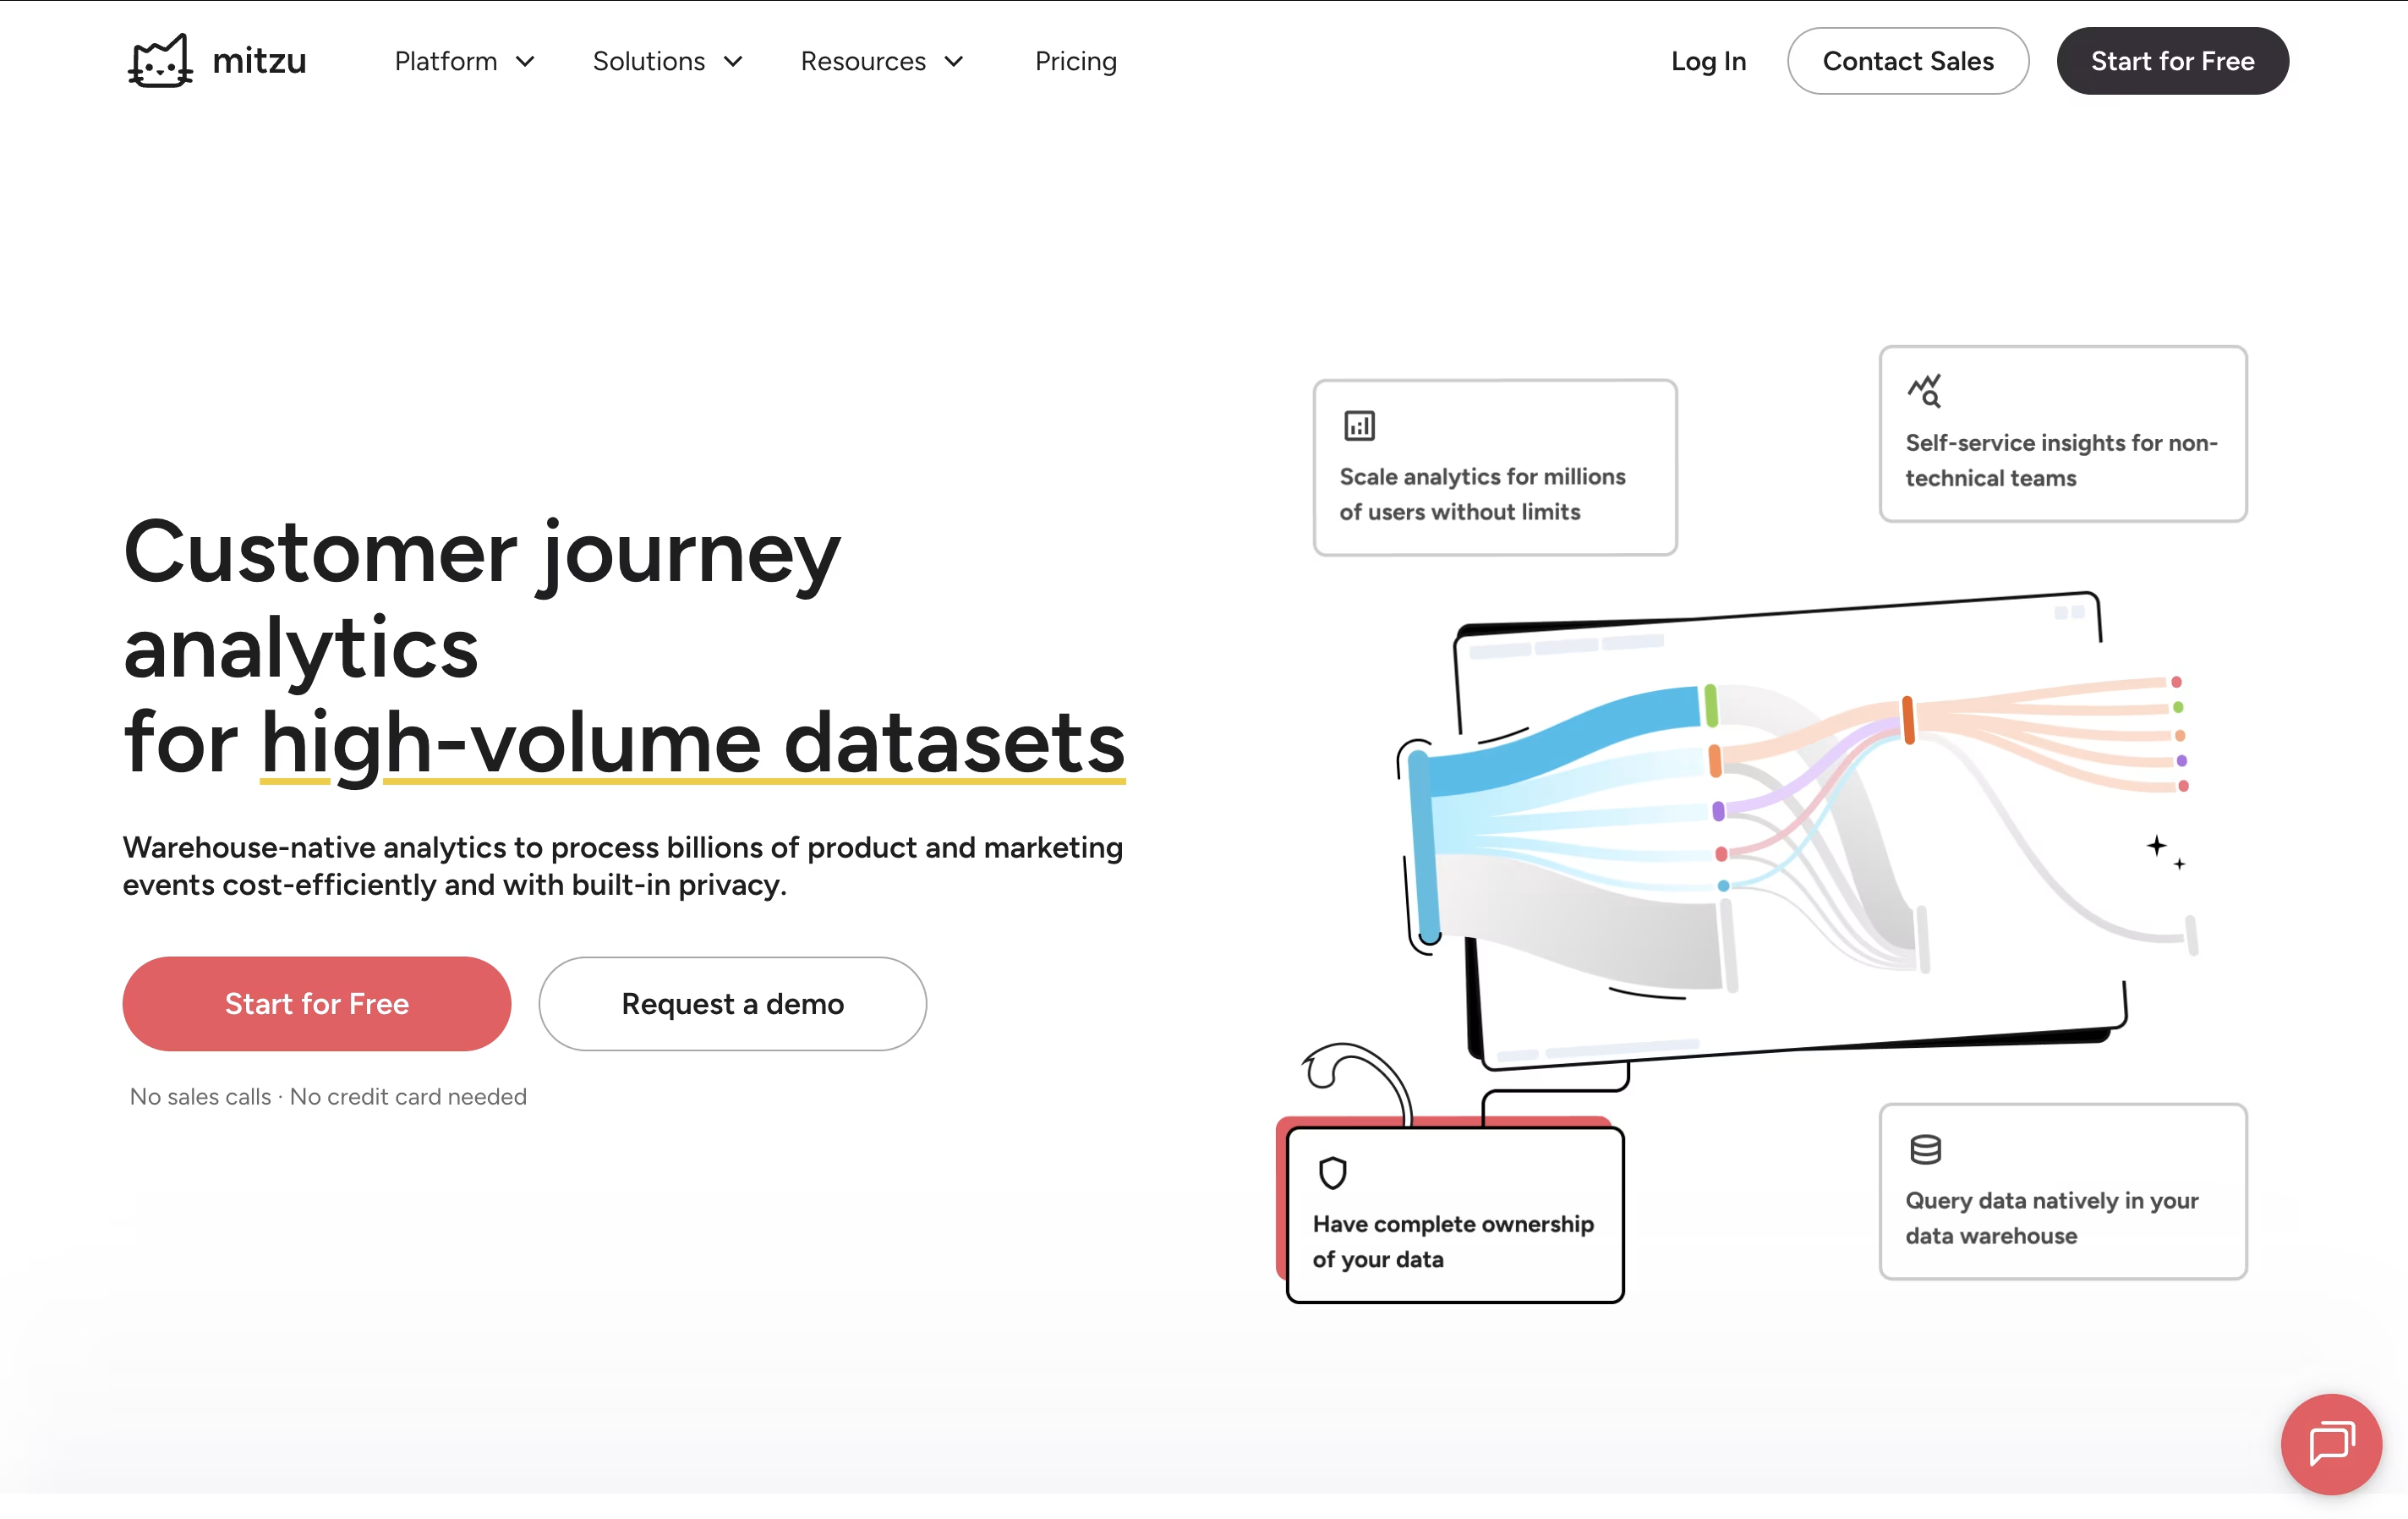
The platform specializes in product, marketing, and revenue analytics, helping teams understand user behavior, track customer journeys, measure retention rates, and analyze conversion funnels. What makes Mitzu unique is its commitment to data privacy - your information never leaves your warehouse.
Instead of copying data to external servers like other analytics tools, Mitzu generates native SQL queries that run directly in your data warehouse. This approach ensures better security, unlimited historical data access, and significant cost savings, especially for businesses with large datasets and many non-paying users.

Appfigures is an all-in-one mobile app analytics and intelligence platform that provides developers and marketers with complete visibility into their app's performance and the competitive landscape. It automatically collects data from major app stores, ad networks, and analytics providers to give you a unified view of your mobile business.
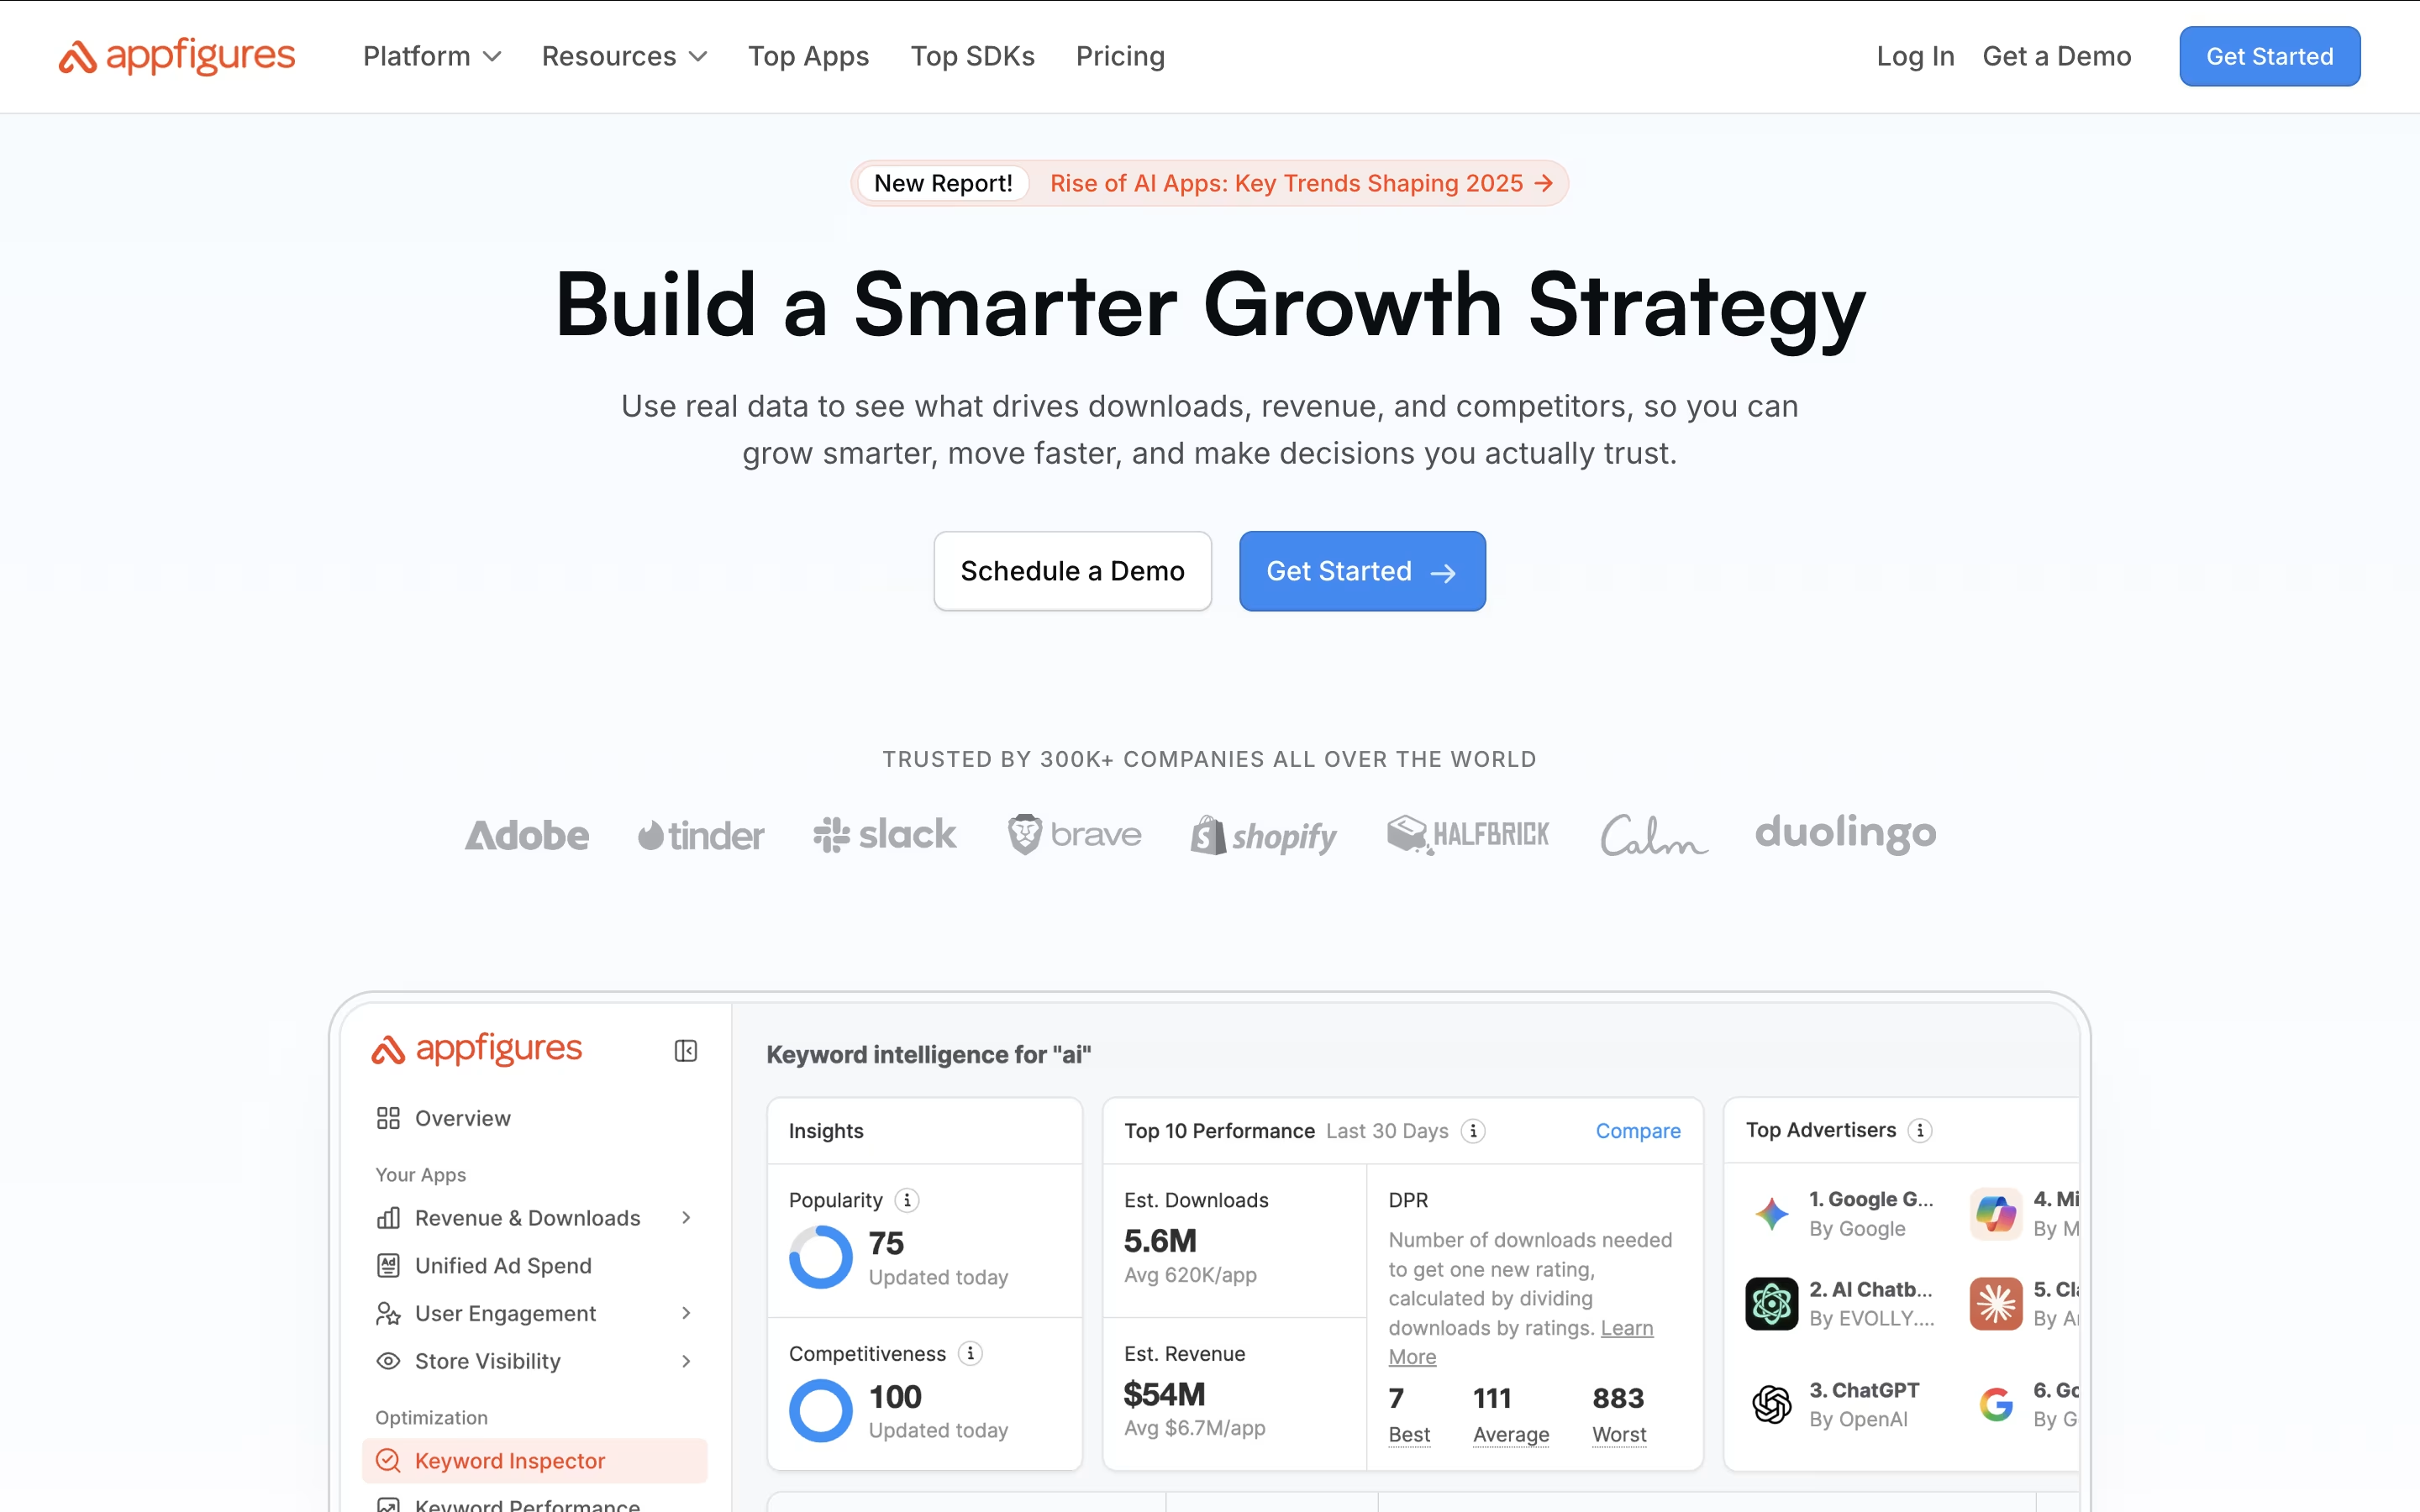
The platform offers three main areas of functionality. First, comprehensive analytics that track downloads, revenue, subscriptions, ratings, and rankings across all app stores. Second, powerful ASO tools that help you discover high-performing keywords, track ranking changes, and optimize your app store listings. Third, competitive intelligence that lets you monitor competitor performance, analyze market trends, and identify growth opportunities.
Whether you're an indie developer with one app or a large publisher managing dozens of apps, Appfigures provides the insights you need to understand your performance, outsmart competitors, and grow downloads organically.

Metabase is an open-source business intelligence platform designed to make data accessible to everyone in your organization. Instead of requiring SQL knowledge or technical training, it provides a visual query builder that lets users click and drag to create charts, graphs, and dashboards.
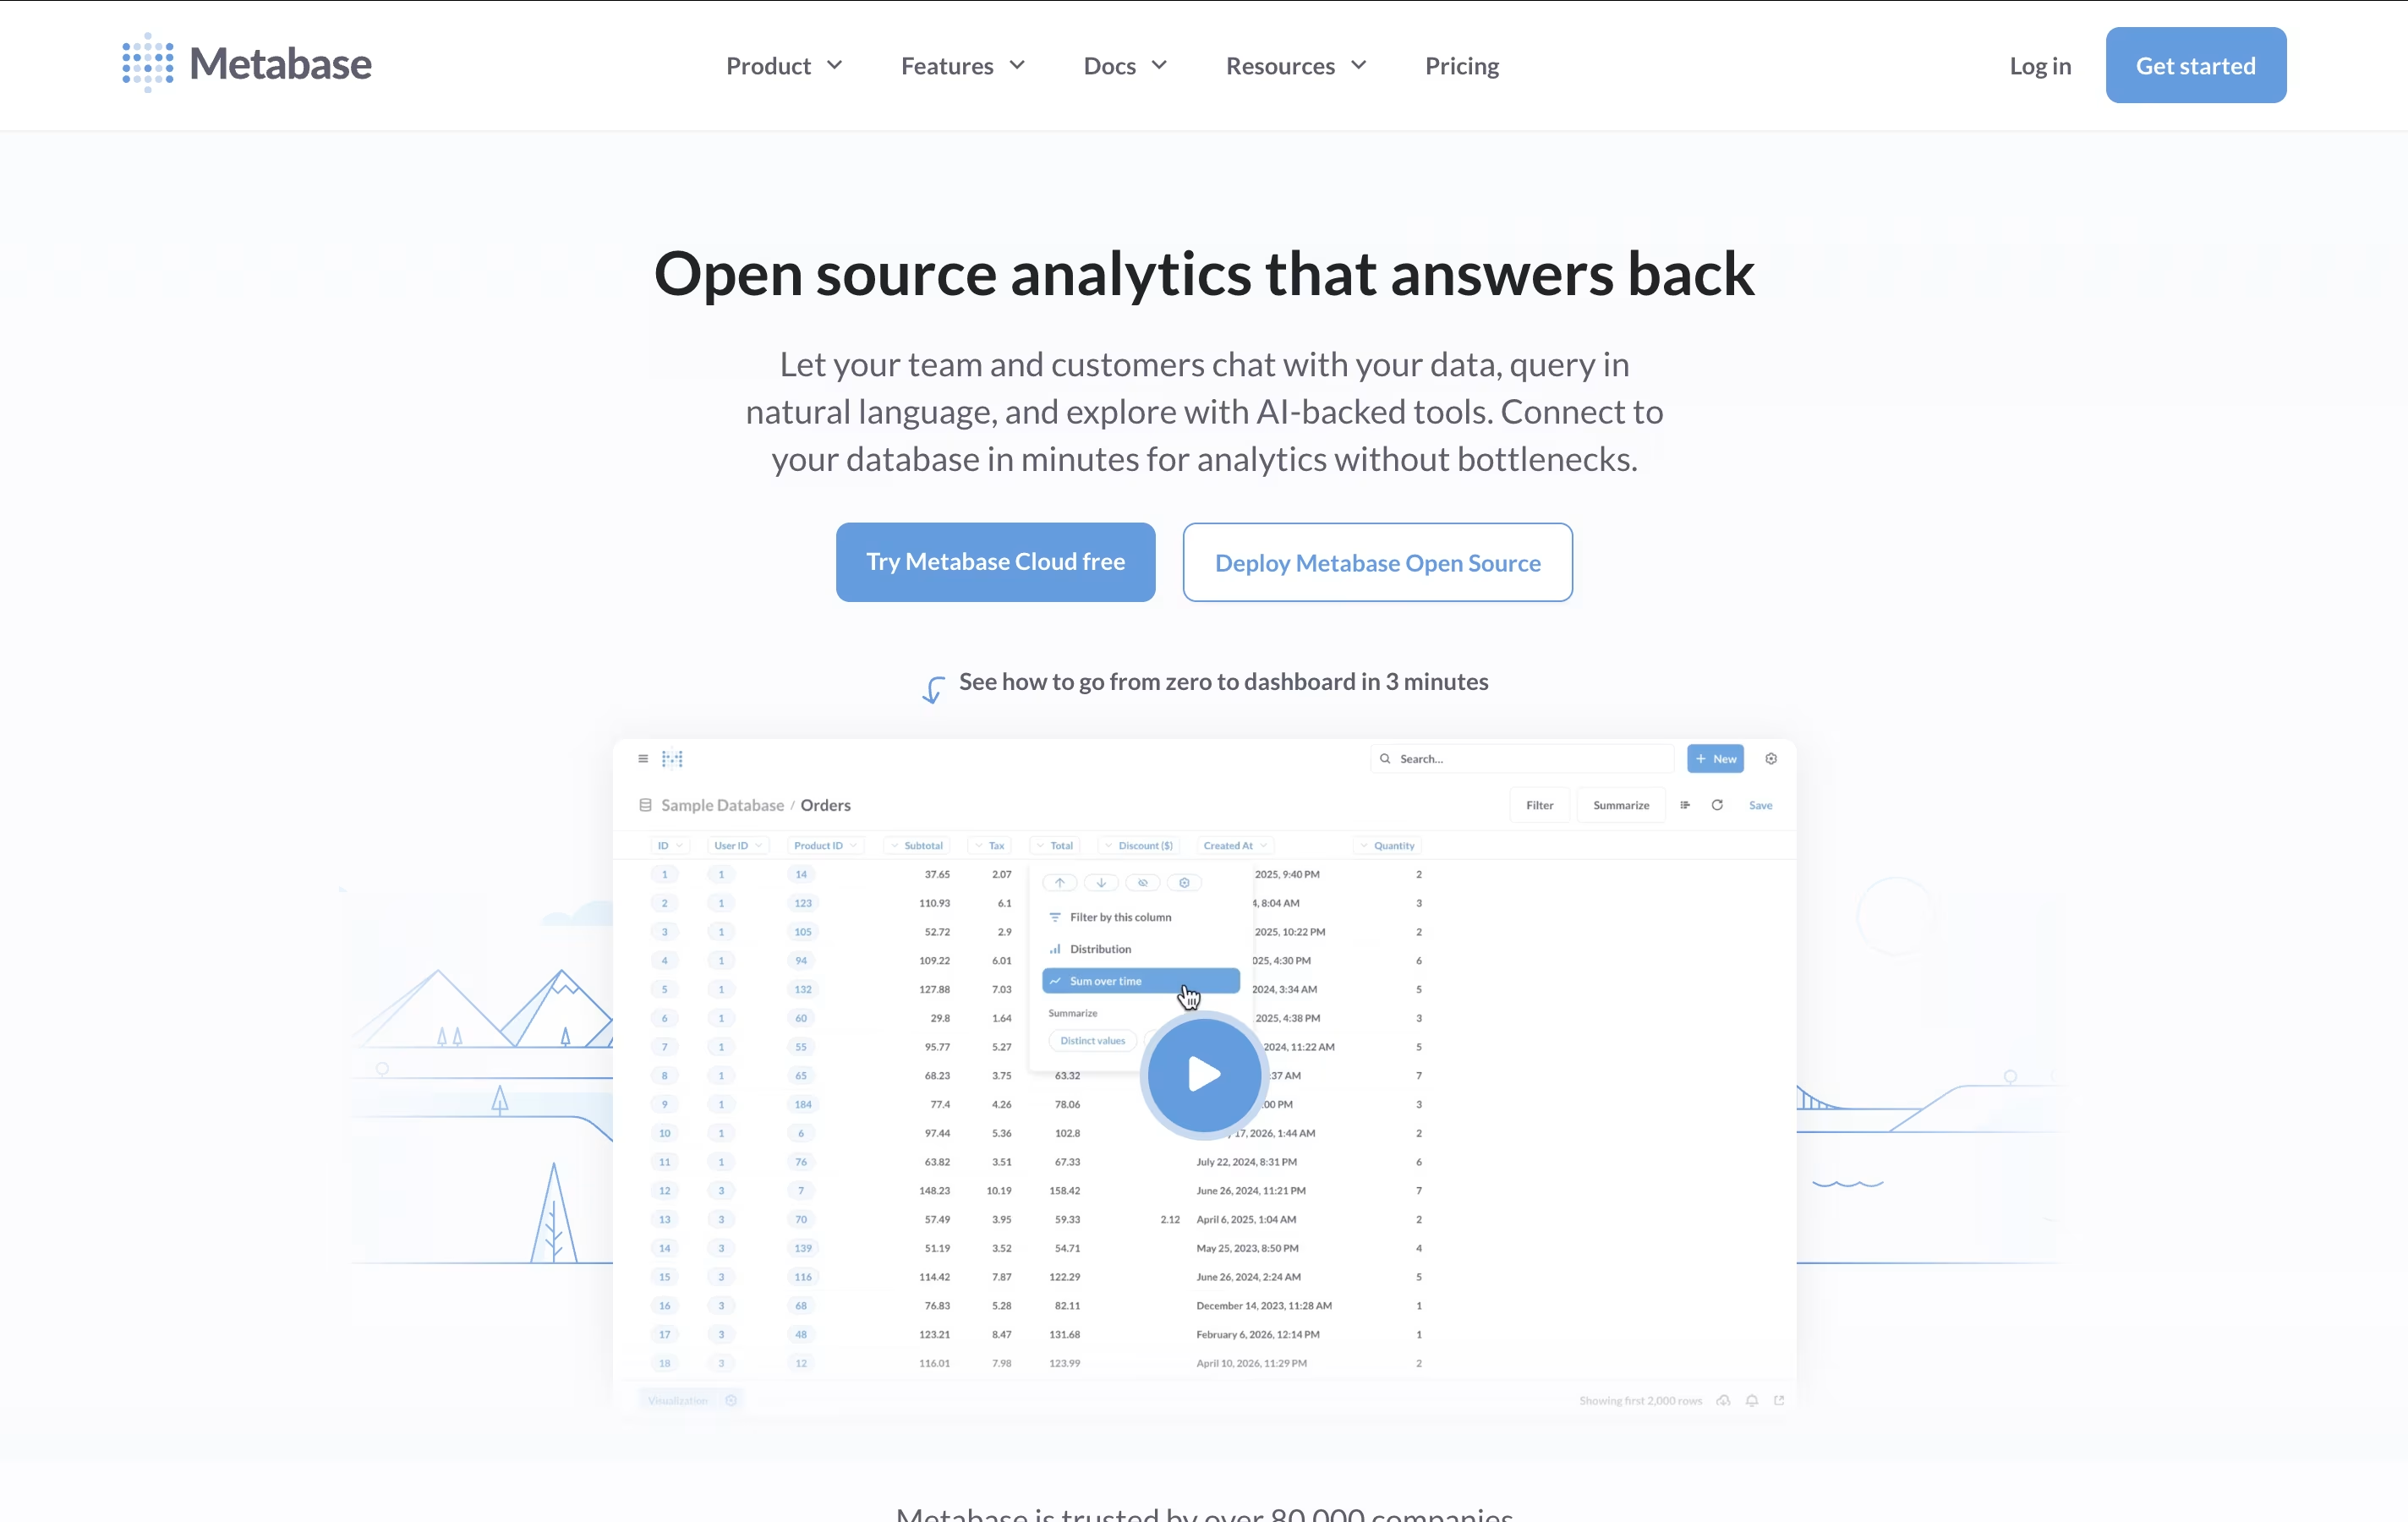
The platform connects to over 20 different databases and data sources, from PostgreSQL and MySQL to cloud services like BigQuery and Snowflake. It queries your data directly without copying or storing it elsewhere, which keeps everything secure and up-to-date.
Metabase offers both self-hosted and cloud deployment options. The open-source version includes all core features for free, while paid plans add advanced permissions, embedding capabilities, and professional support. Whether you're a startup analyzing customer data or an enterprise building internal dashboards, Metabase scales from simple charts to complex multi-user analytics platforms.

MotherDuck is a serverless cloud analytics platform that extends DuckDB's capabilities to the cloud. Think of it as "DuckDB as a Service" – you get all the speed and simplicity of DuckDB but with cloud-scale storage, sharing, and collaboration features.
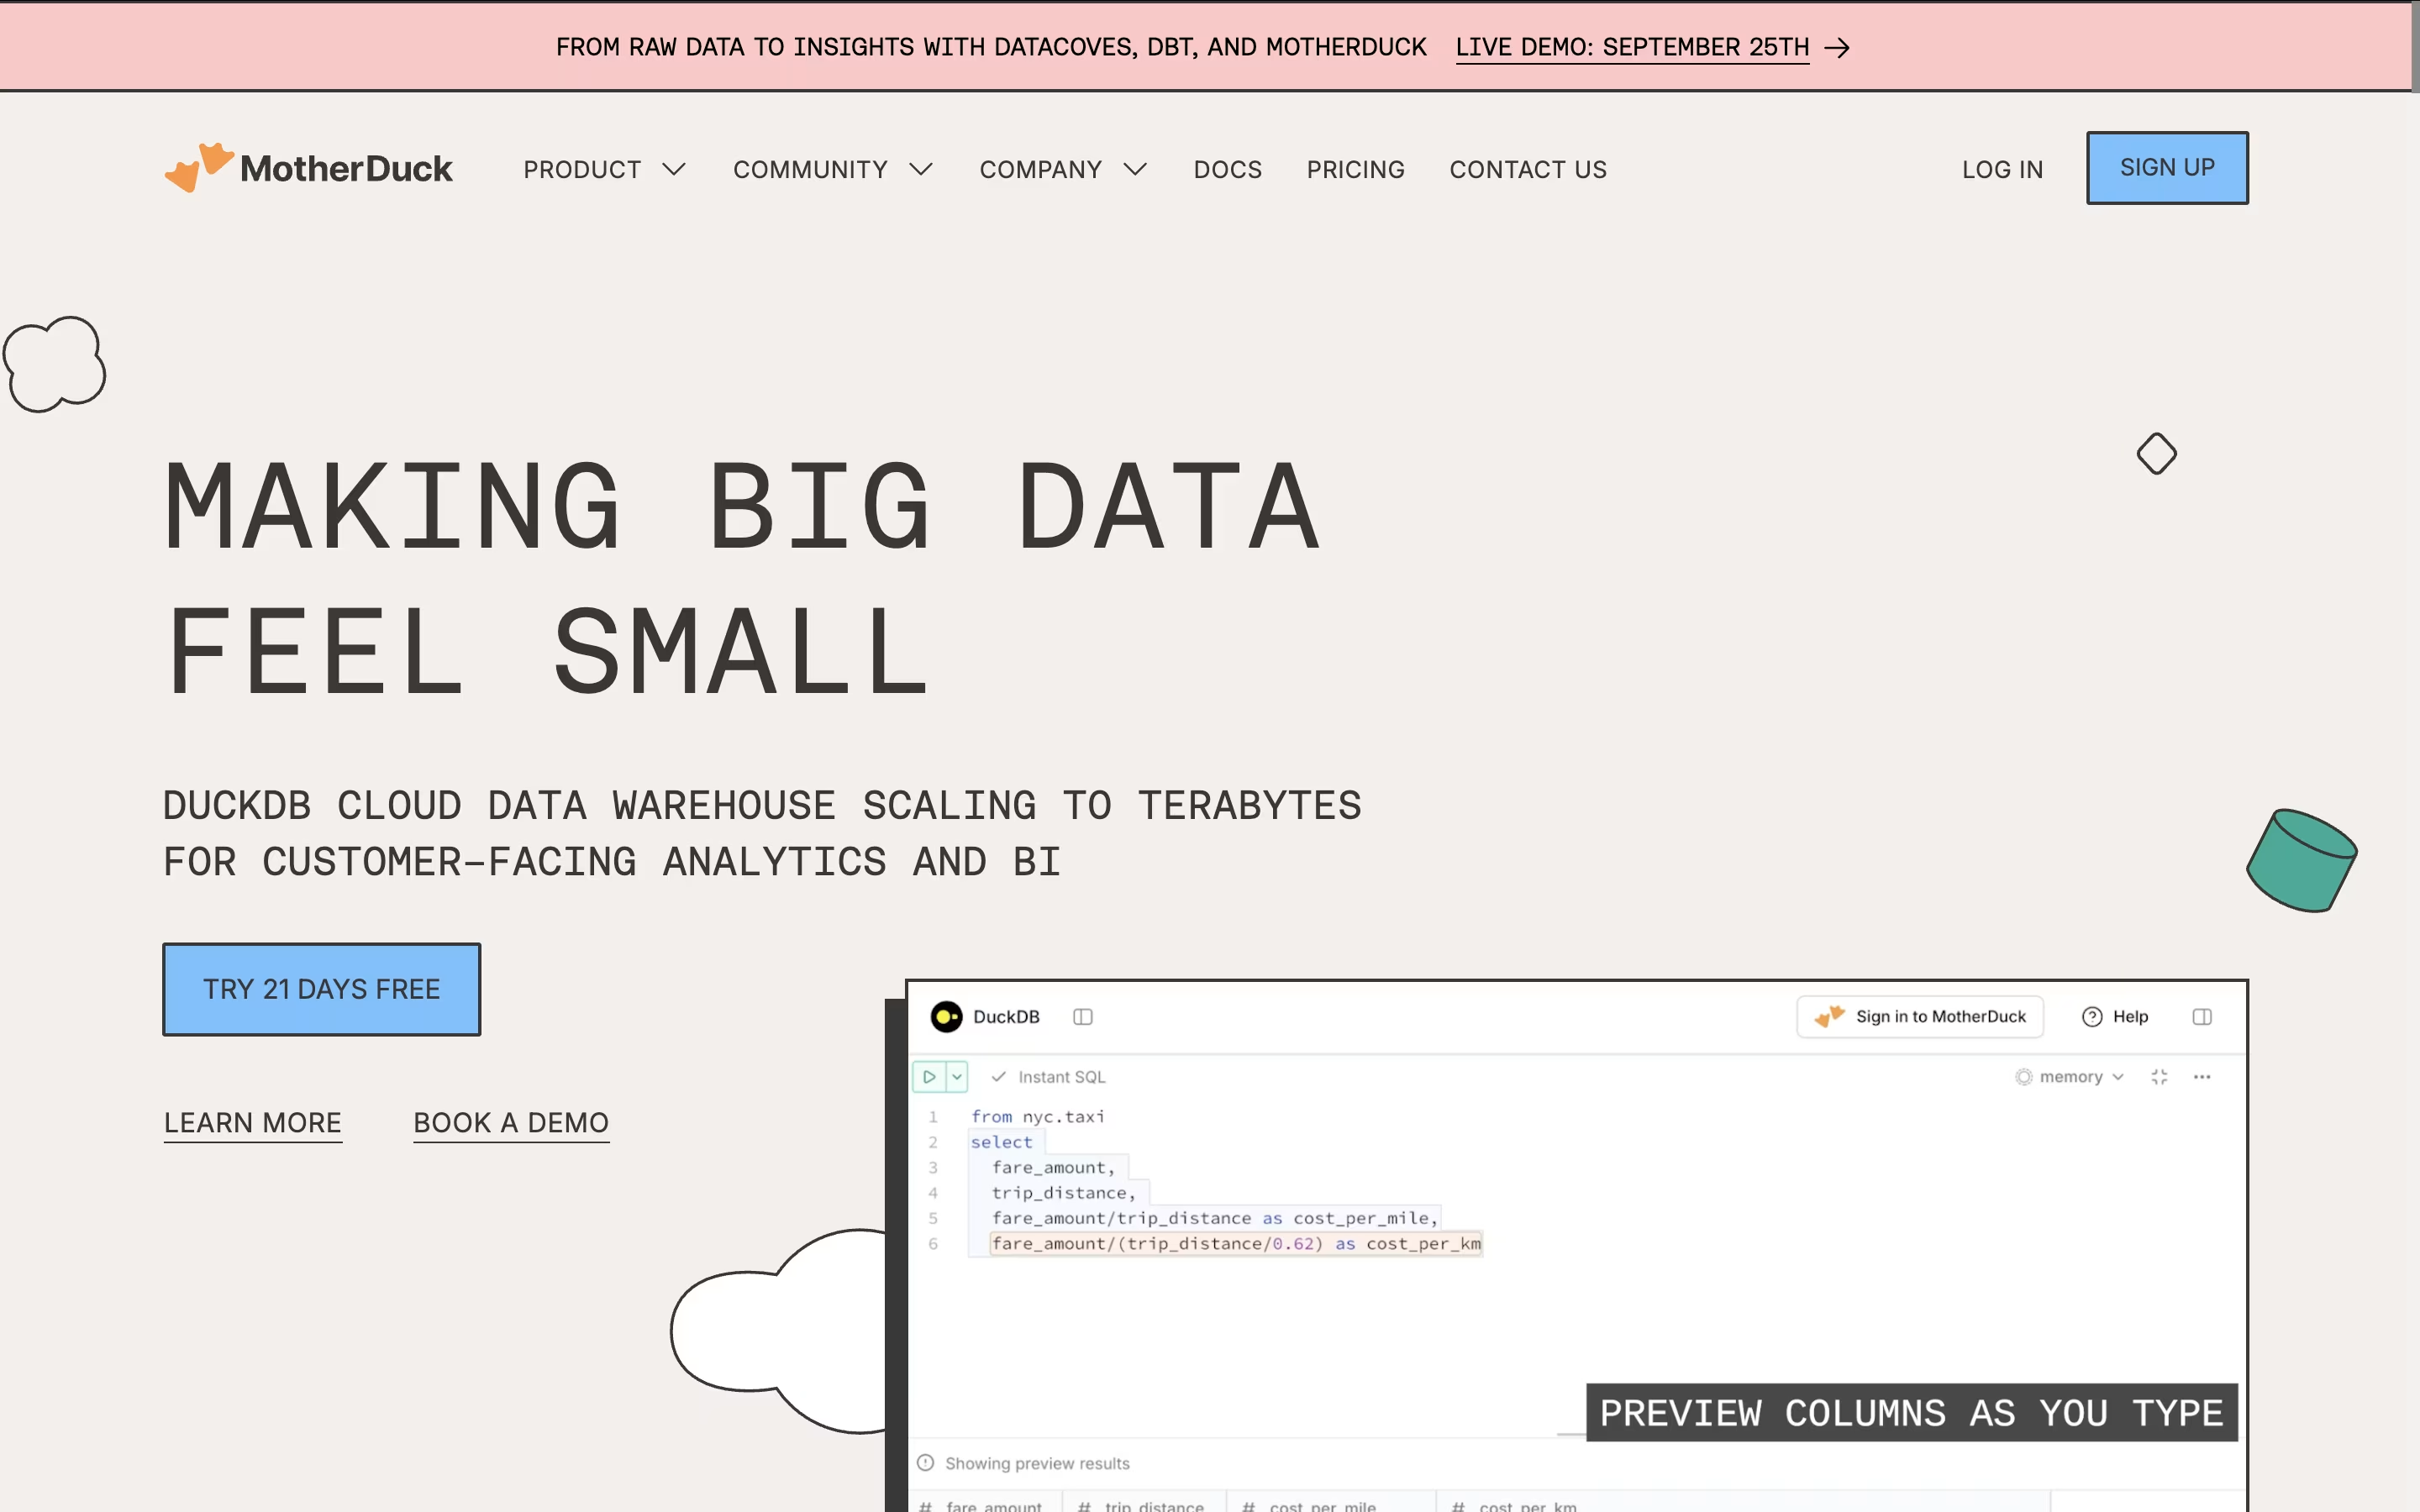
The platform uses a unique hybrid processing model where queries can run on your local machine, in the cloud, or both simultaneously. This means you keep the fast performance of local analytics while gaining the benefits of cloud computing when you need them. Each user gets their own isolated compute instance, eliminating resource conflicts and ensuring consistent performance.
Founded by database veterans from companies like Google BigQuery and Snowflake, MotherDuck is designed for teams who want powerful analytics without the complexity of traditional data warehouses. It supports standard SQL, integrates with popular data tools, and makes sharing data as simple as sending a link.

Pendo is an all-in-one Software Experience Management platform designed to help businesses understand and improve how users interact with their digital products. Think of it as the central command center for your product team, combining analytics, guidance, and feedback tools in one place.
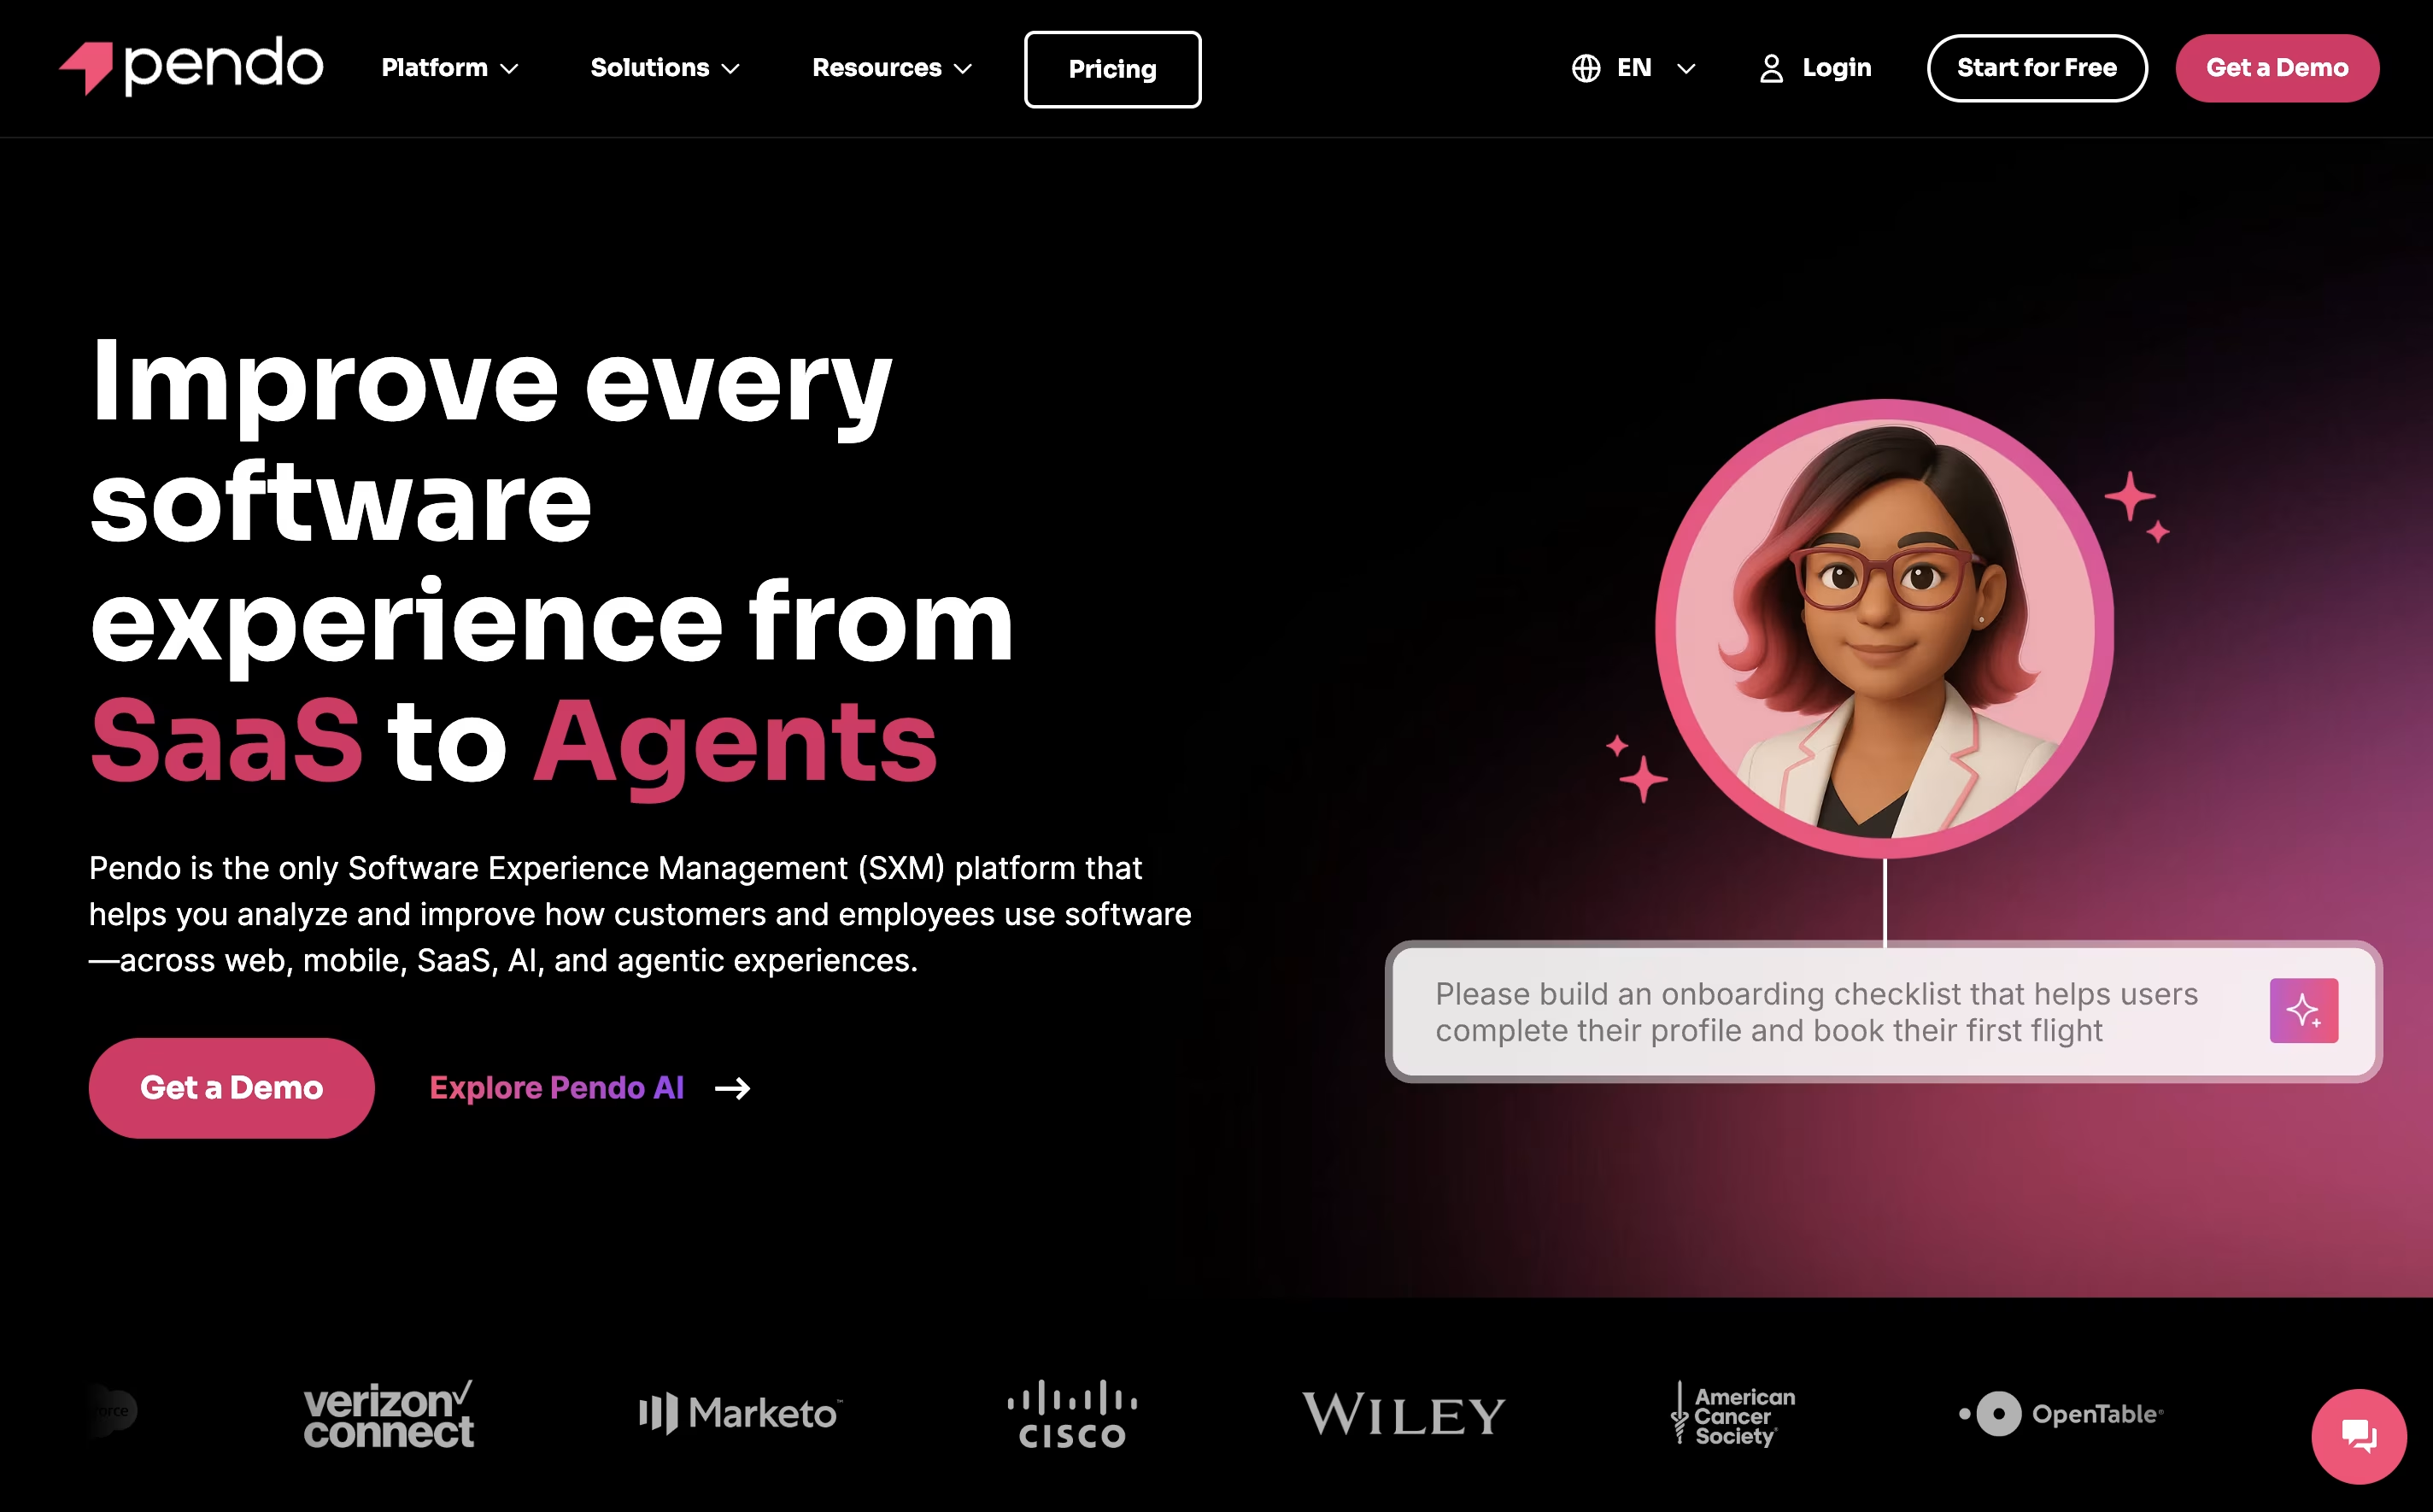
The platform automatically captures user interactions like clicks, page views, and navigation patterns without requiring manual coding or event tracking. This means you can see exactly how people use your software from day one. Pendo goes beyond just showing numbers by providing in-app messaging capabilities, allowing you to guide users with tooltips, walkthroughs, and announcements directly within your application.
What sets Pendo apart is its no-code approach. Product teams can create user guides, launch surveys, and analyze behavior without needing developers. The platform serves companies of all sizes, from startups to enterprise organizations, helping them increase user adoption, reduce churn, and make informed product decisions.

UI Bakery is a low-code development platform that lets you build web applications using a visual drag-and-drop interface combined with custom code when needed. Unlike pure no-code tools, UI Bakery gives developers full control through JavaScript and SQL customization while speeding up the building process significantly.
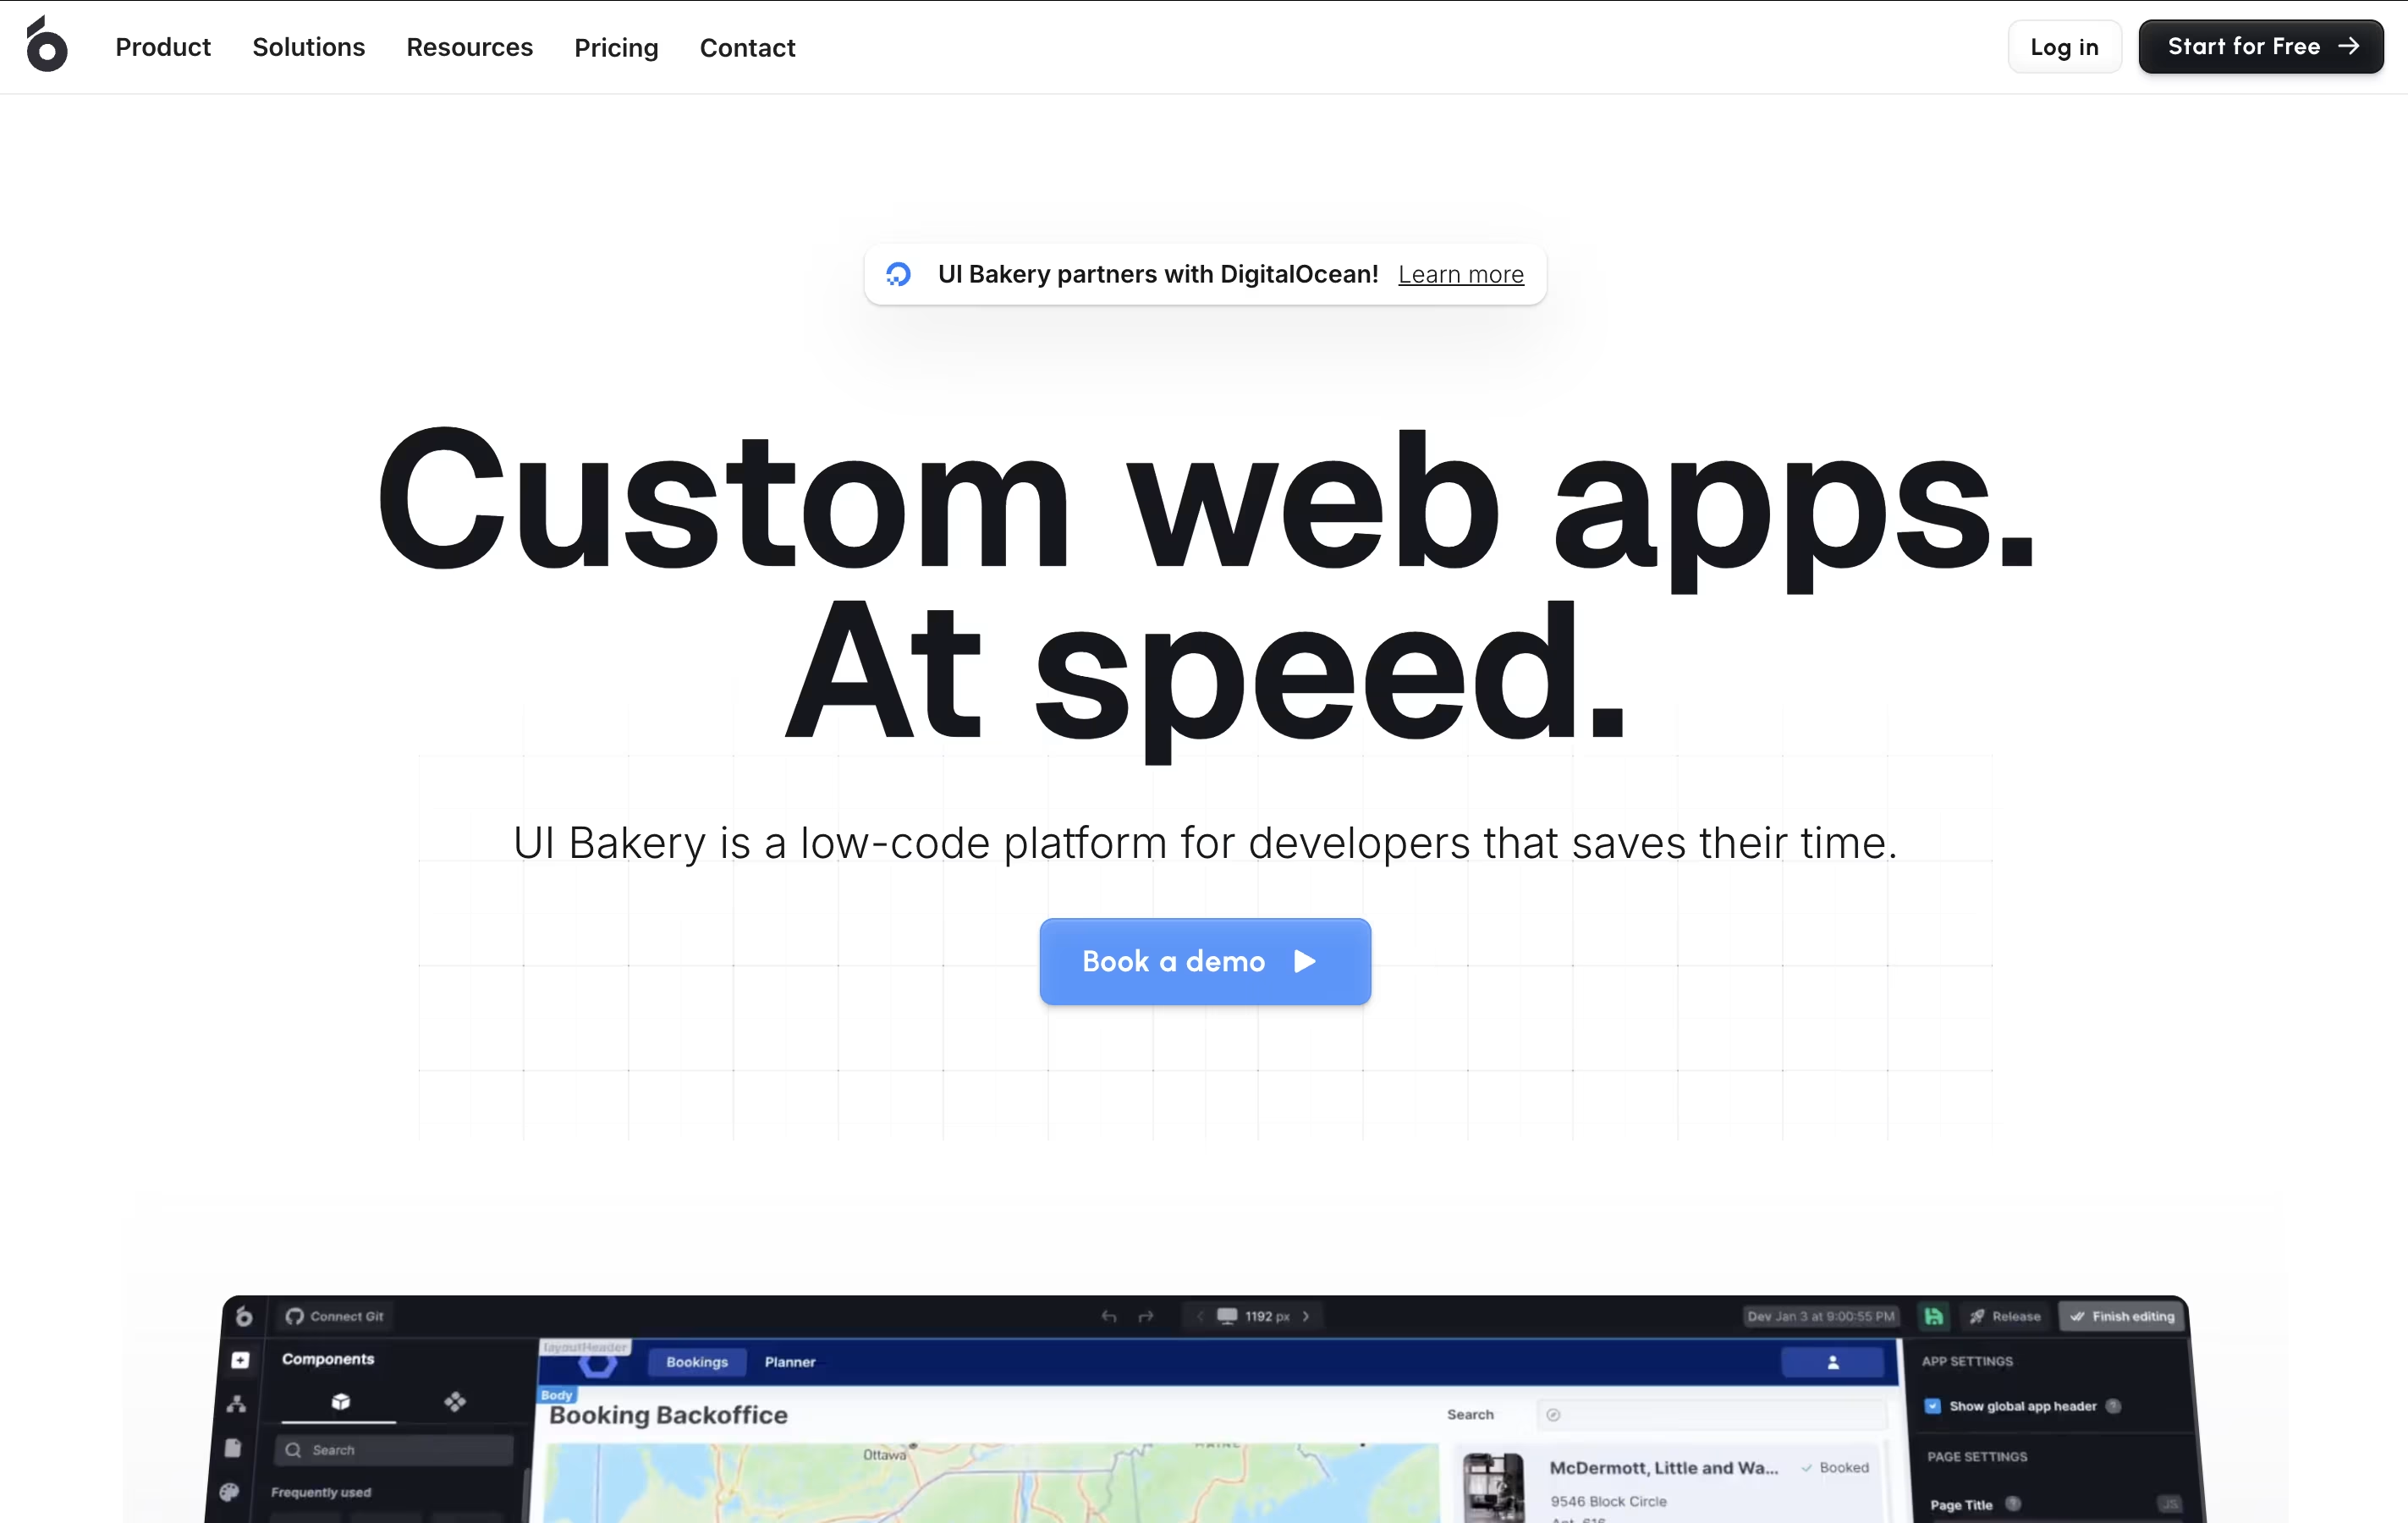
The platform includes 75+ ready-made components, templates, and connectors to popular databases and services. You can create internal tools, customer portals, admin dashboards, and vendor apps without worrying about frontend frameworks or CSS styling. UI Bakery handles deployment, version control, and user access management automatically.
Available as both cloud-hosted and self-hosted options, UI Bakery works great for teams that need compliance with data security requirements while maintaining development speed and flexibility.

Amplitude is a product analytics platform that tracks user behavior through events and interactions. Unlike traditional web analytics that focus on page views, Amplitude captures specific actions like button clicks, feature usage, and user flows to create detailed user journey maps.
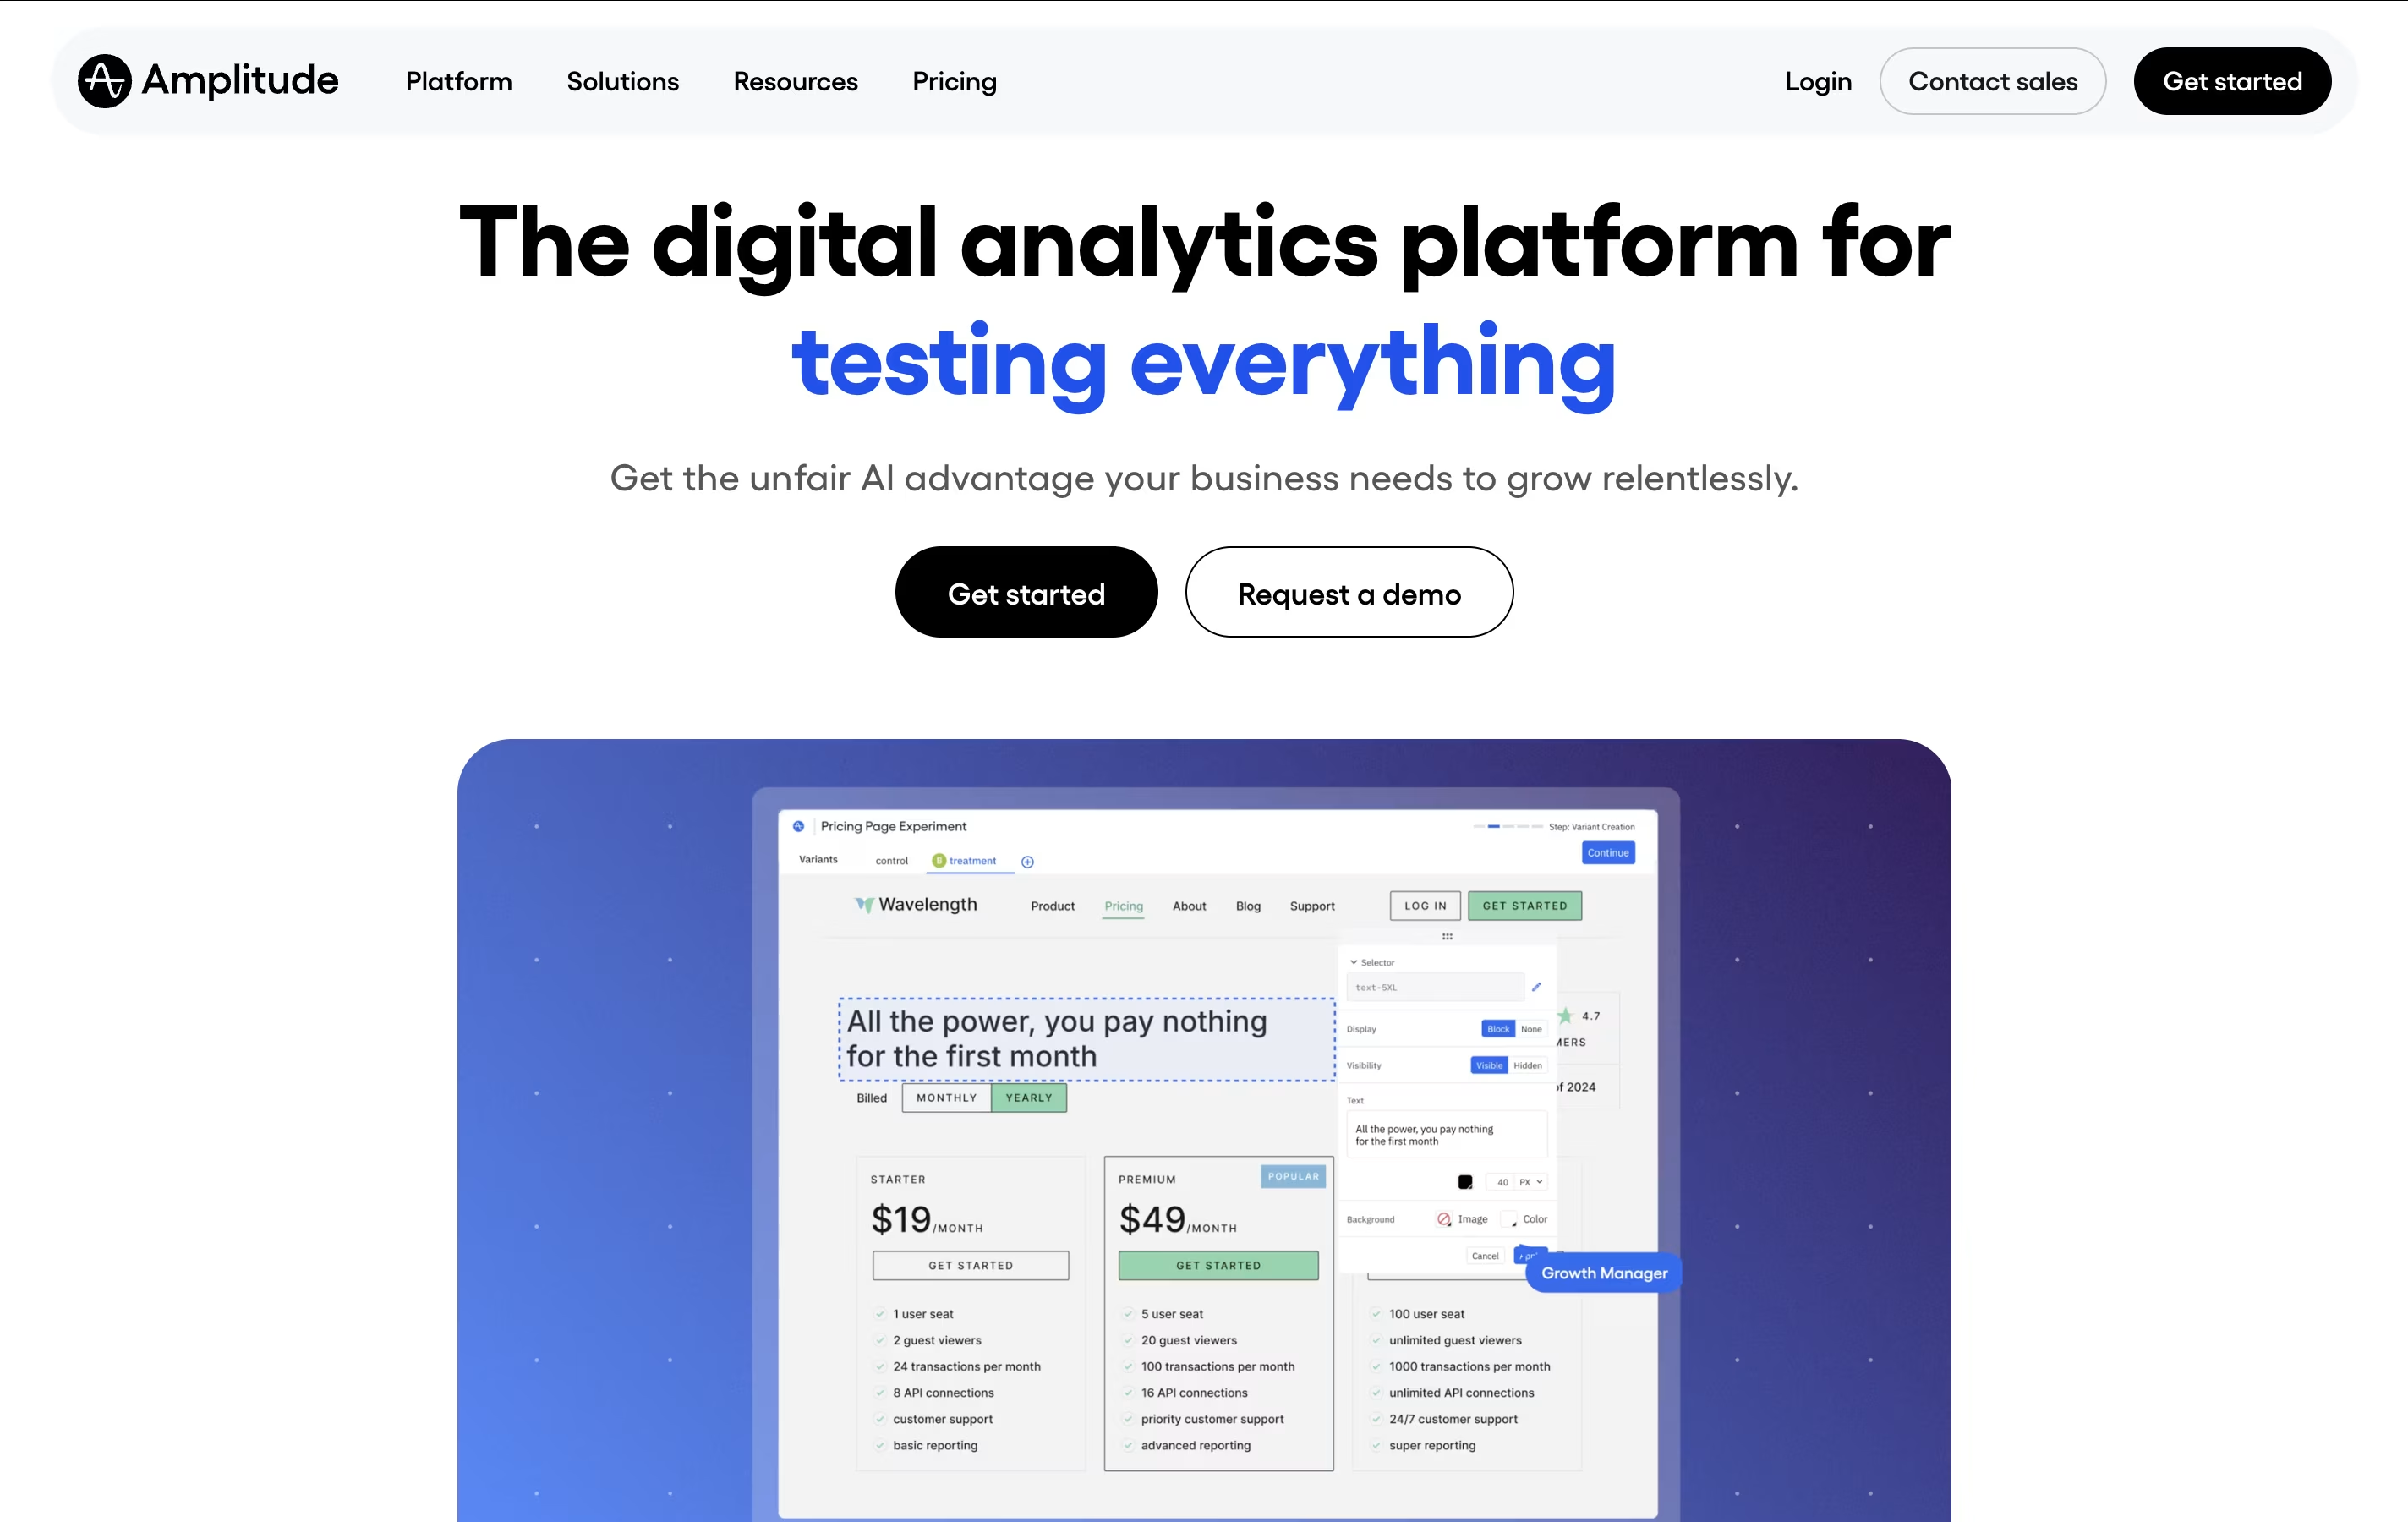
The platform helps businesses answer critical questions like "Which features drive retention?" and "Where do users drop off in our funnel?" It provides real-time insights through advanced segmentation, cohort analysis, and behavioral tracking that help teams optimize their products and improve user experience.
Amplitude offers multiple pricing tiers from a free Starter plan to Enterprise solutions. The platform integrates with popular tools and provides features like A/B testing, user segmentation, and predictive analytics. It's trusted by product managers, growth teams, and data analysts who need to make informed decisions based on actual user behavior rather than guesswork.

Luzmo is an embedded analytics platform built for SaaS companies that want to add data visualization capabilities to their products. Think of it as a toolkit that lets you embed interactive dashboards, charts, and reports directly into your application without building everything from scratch.
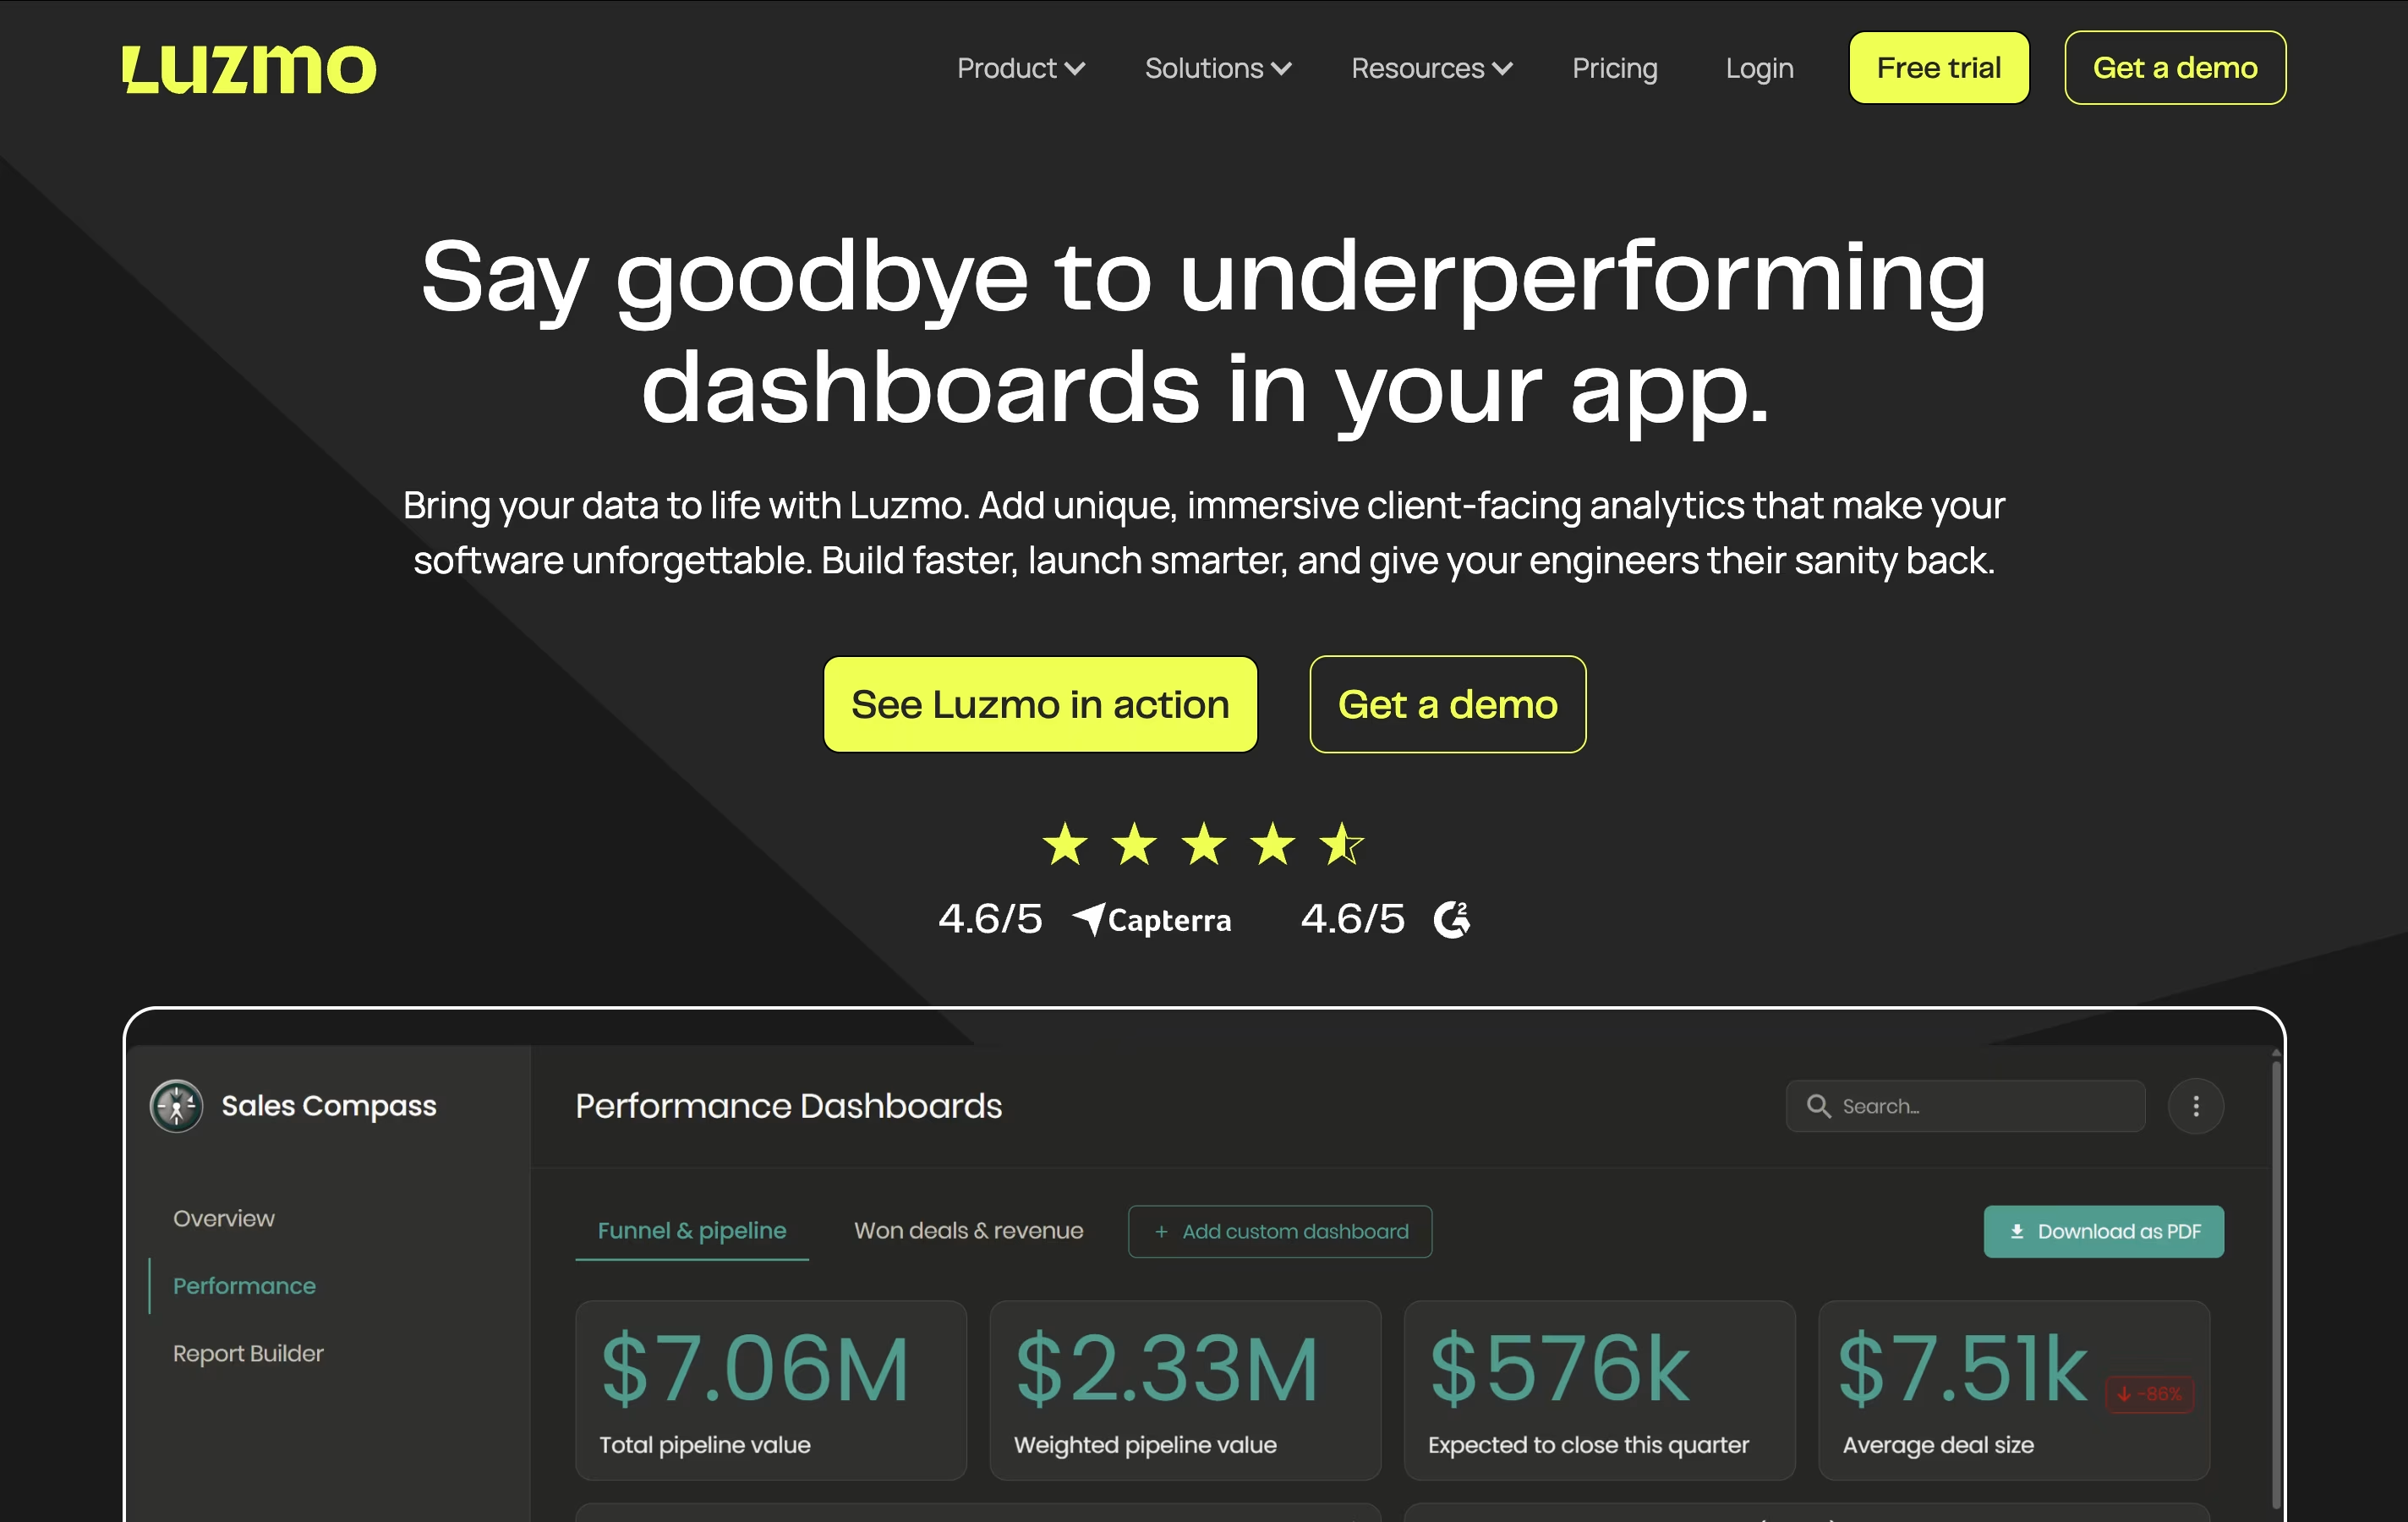
The platform provides everything needed for embedded analytics: drag-and-drop dashboard builders, AI-powered insights, real-time data connections, and complete white-label customization. Your users can interact with data, create their own visualizations, and get insights without ever leaving your application.
What makes Luzmo special is its focus on embedding. Unlike traditional business intelligence tools meant for internal use, Luzmo is designed to become part of your product experience. It supports multi-tenancy, allowing you to serve analytics to many customers while keeping their data completely separate and secure.

ChartMogul is a subscription analytics platform that automatically imports data from your billing systems and converts it into meaningful business metrics. Instead of spending hours calculating revenue numbers in spreadsheets, you get instant access to key performance indicators that matter for subscription businesses.
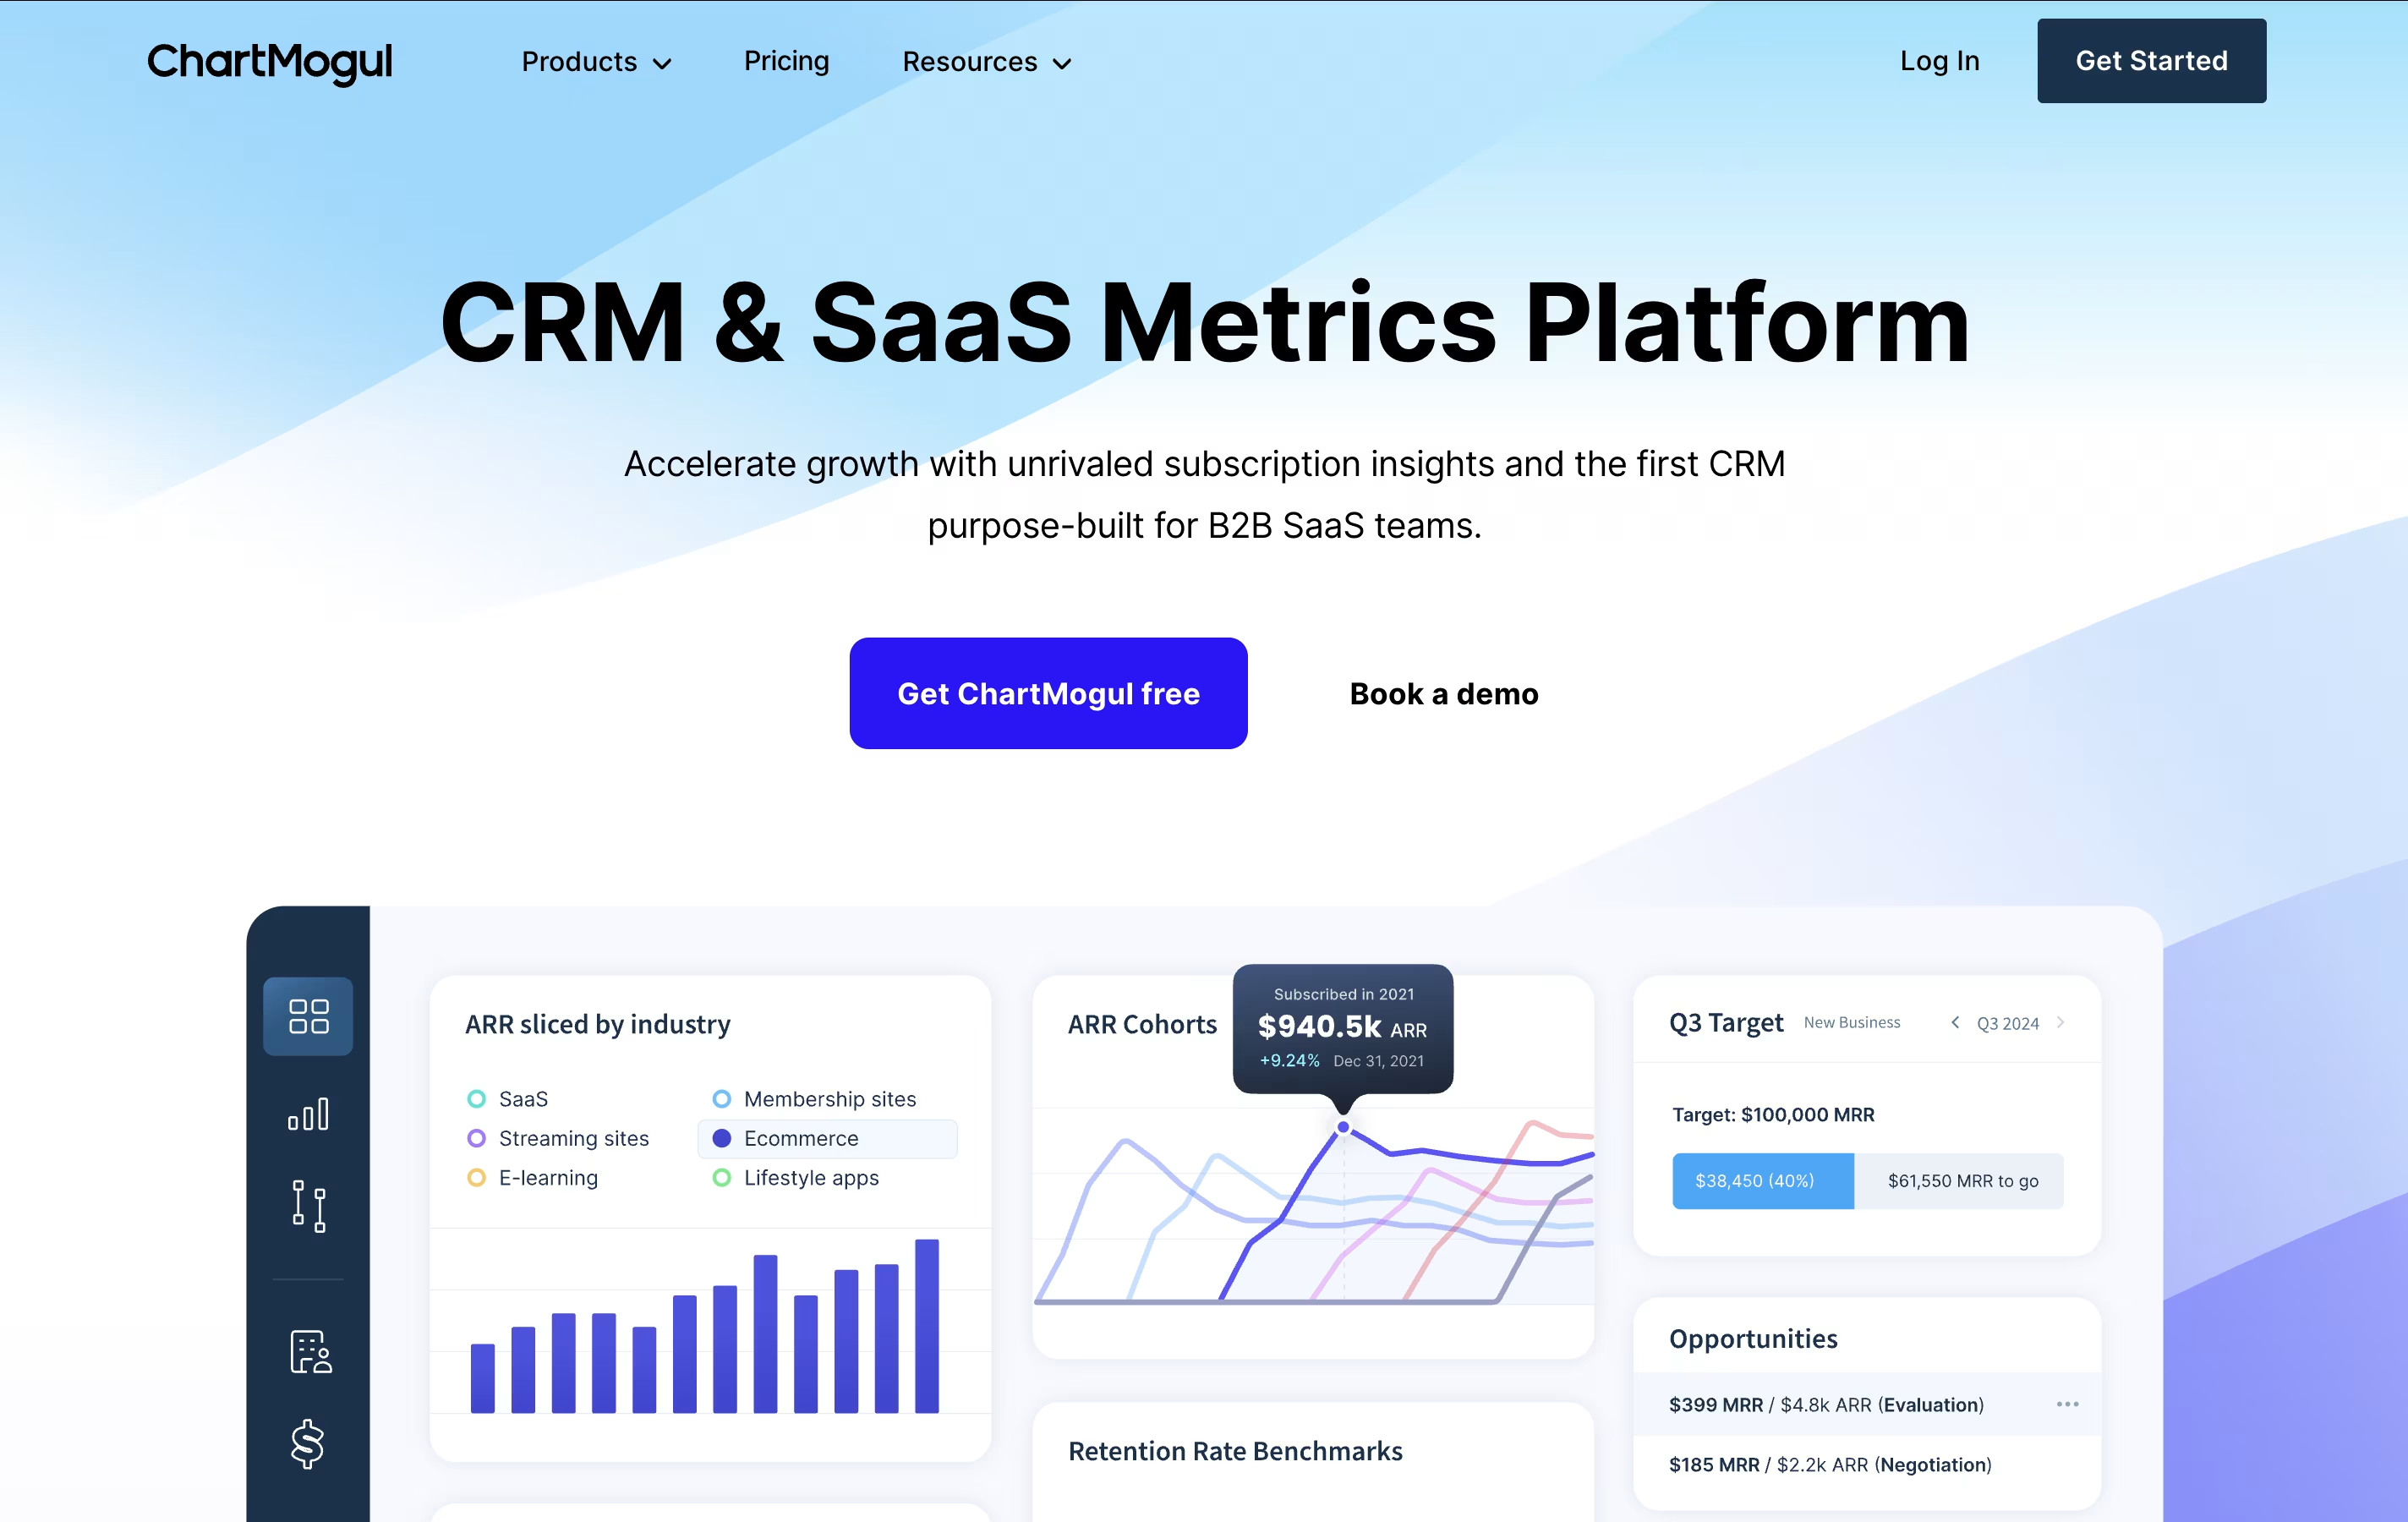
The platform tracks essential metrics like Monthly Recurring Revenue, Annual Recurring Revenue, customer churn rates, and customer lifetime value. It also provides cohort analysis, segmentation tools, and benchmarking features to compare your performance against industry standards.
ChartMogul offers both analytics and CRM functionality, making it a complete solution for managing subscription data and customer relationships. It serves businesses from early-stage startups to enterprise companies, with pricing based on your revenue size.

Basedash is an AI-powered platform that turns your database into a collaborative workspace for visualizing, editing, and exploring data without any coding knowledge. Think of it as having a conversation with your data – you ask questions in plain English, and Basedash creates charts, dashboards, and admin panels automatically.
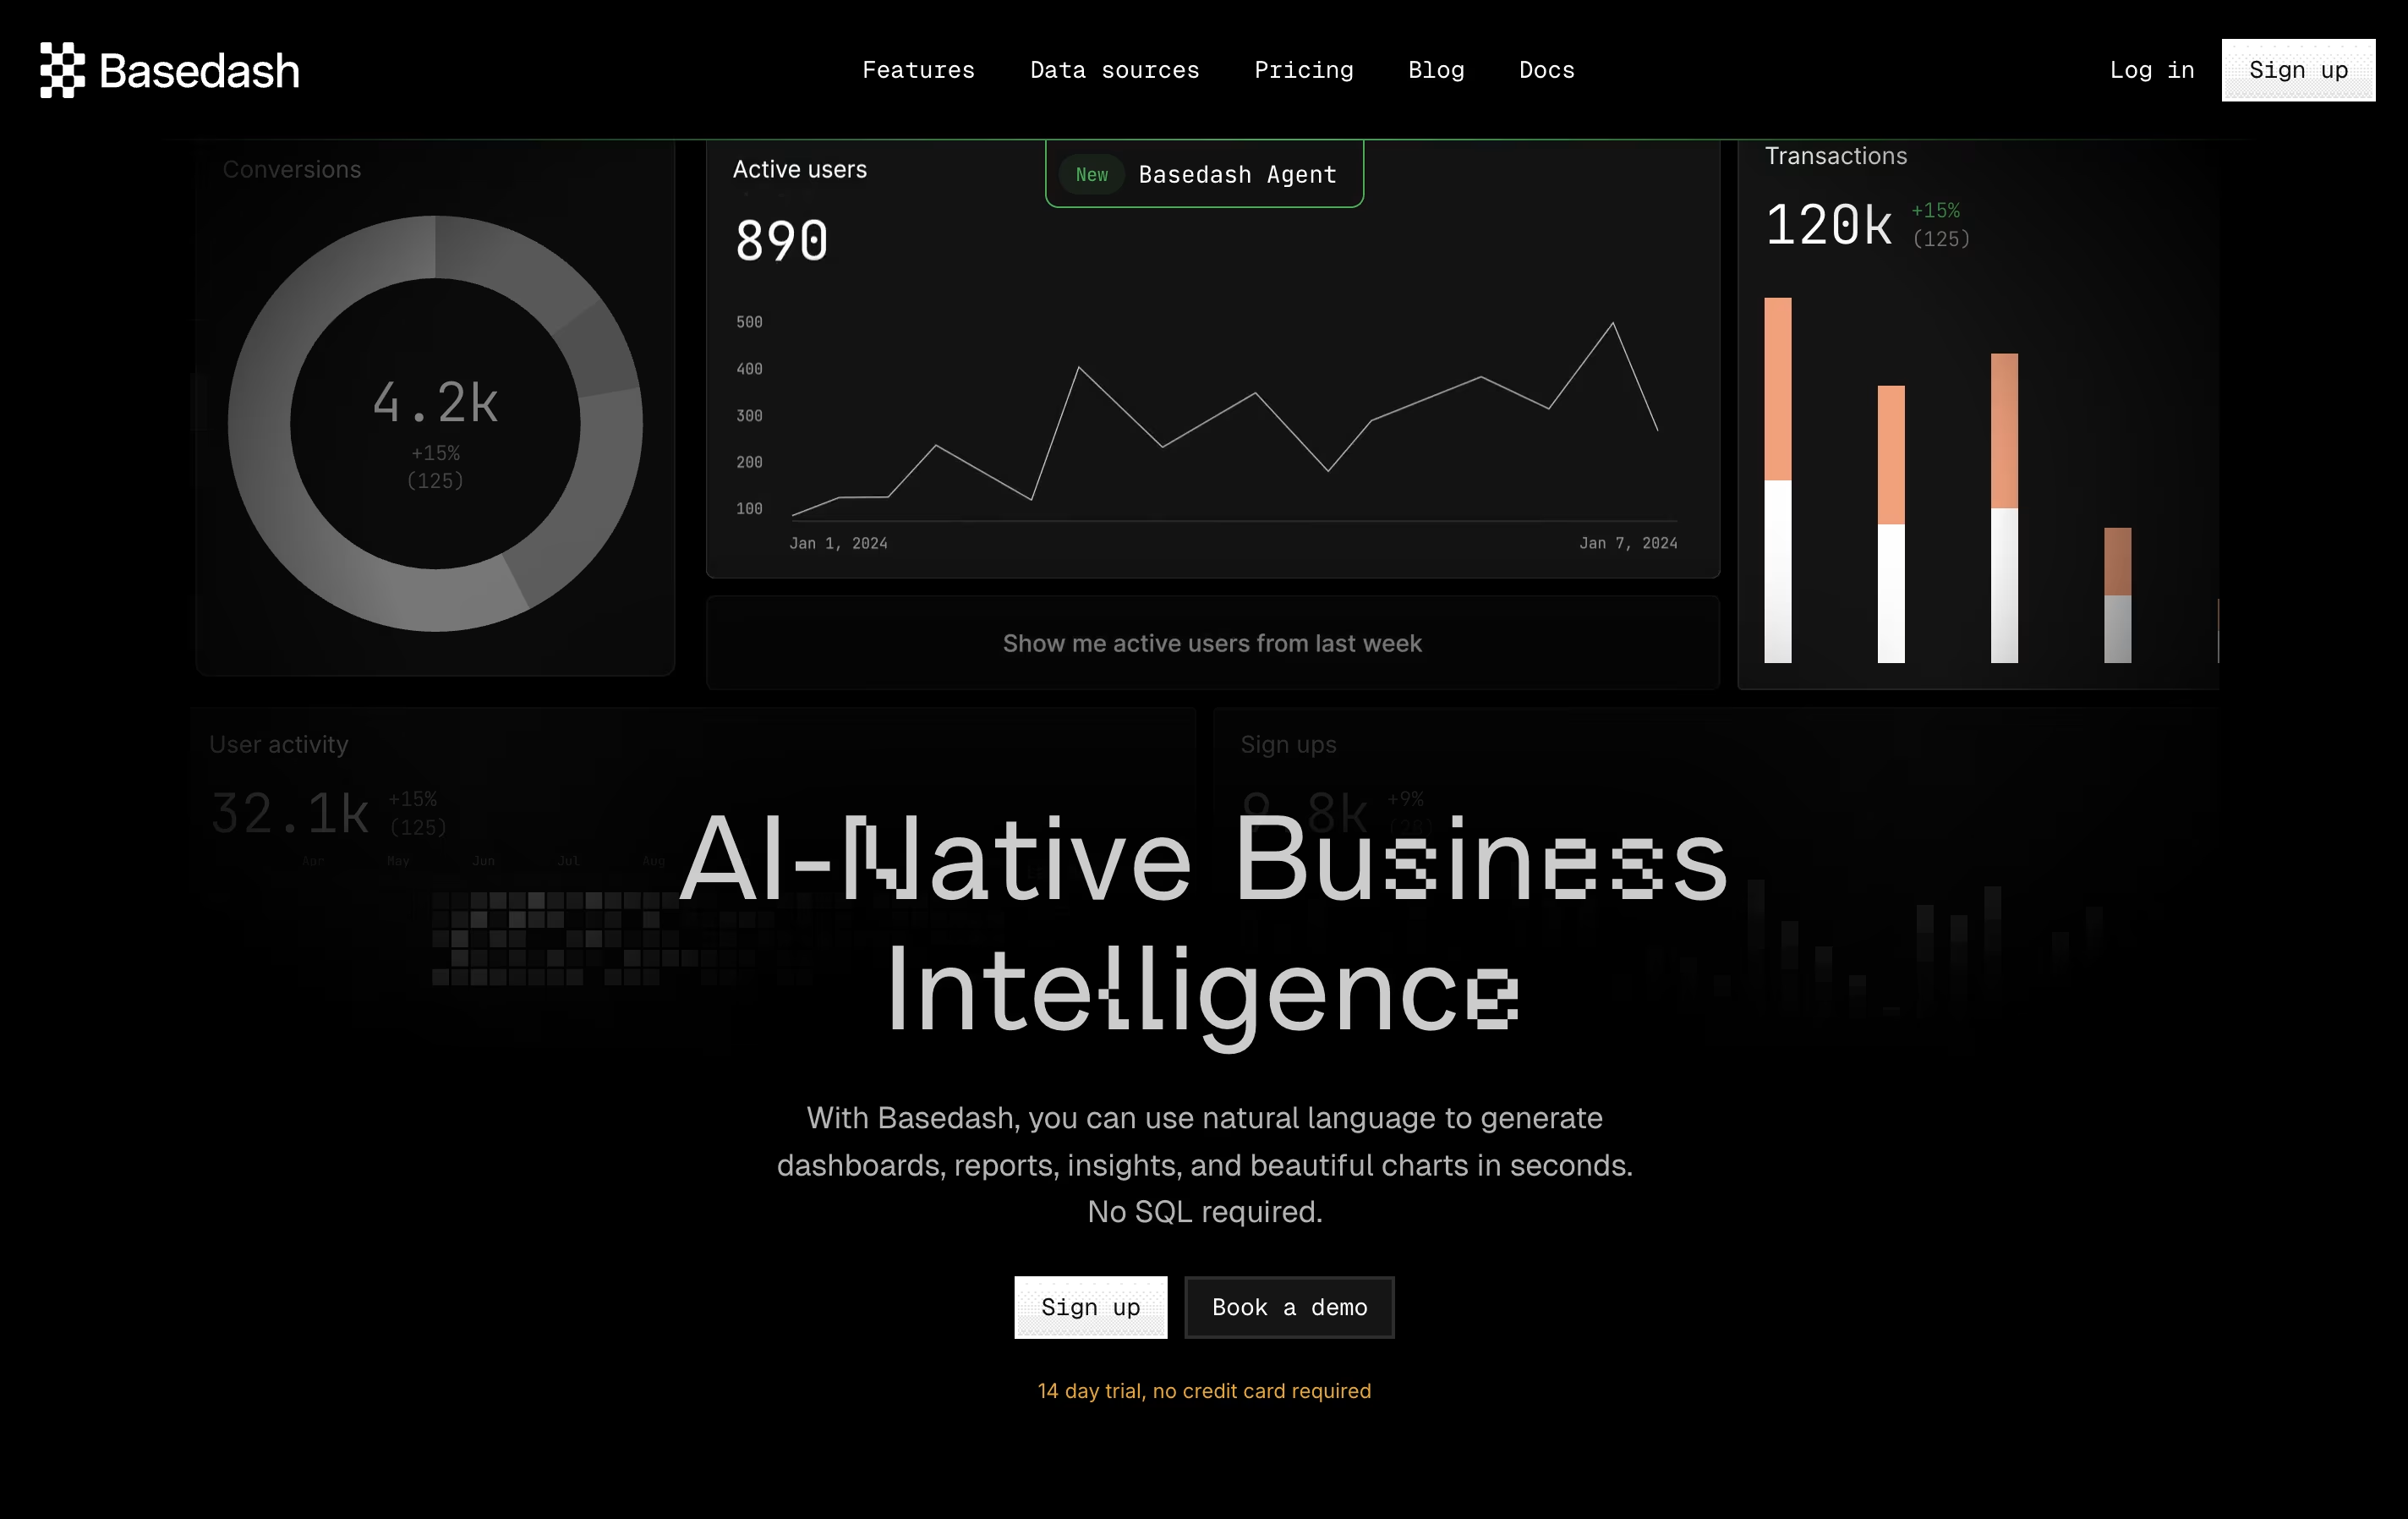
The platform works by connecting directly to your database or data warehouse, then using artificial intelligence to understand your data structure and relationships. You can create custom CRM systems, build business intelligence dashboards, generate reports, and manage your data through an intuitive interface that feels like using a spreadsheet.
What sets Basedash apart is its natural language processing capabilities. Instead of writing SQL queries or learning complex tools, you simply tell it what you want to see, and it creates the visualization for you instantly.

Skywork AI is an AI-powered workspace platform that transforms simple ideas into complete, professional content across multiple formats. Unlike basic AI writing tools, Skywork offers specialized agents for specific tasks: Documents Agent for reports and papers, Slides Agent for presentations, Sheets Agent for data analysis, Podcast Agent for audio content, and Web Agent for creating websites.
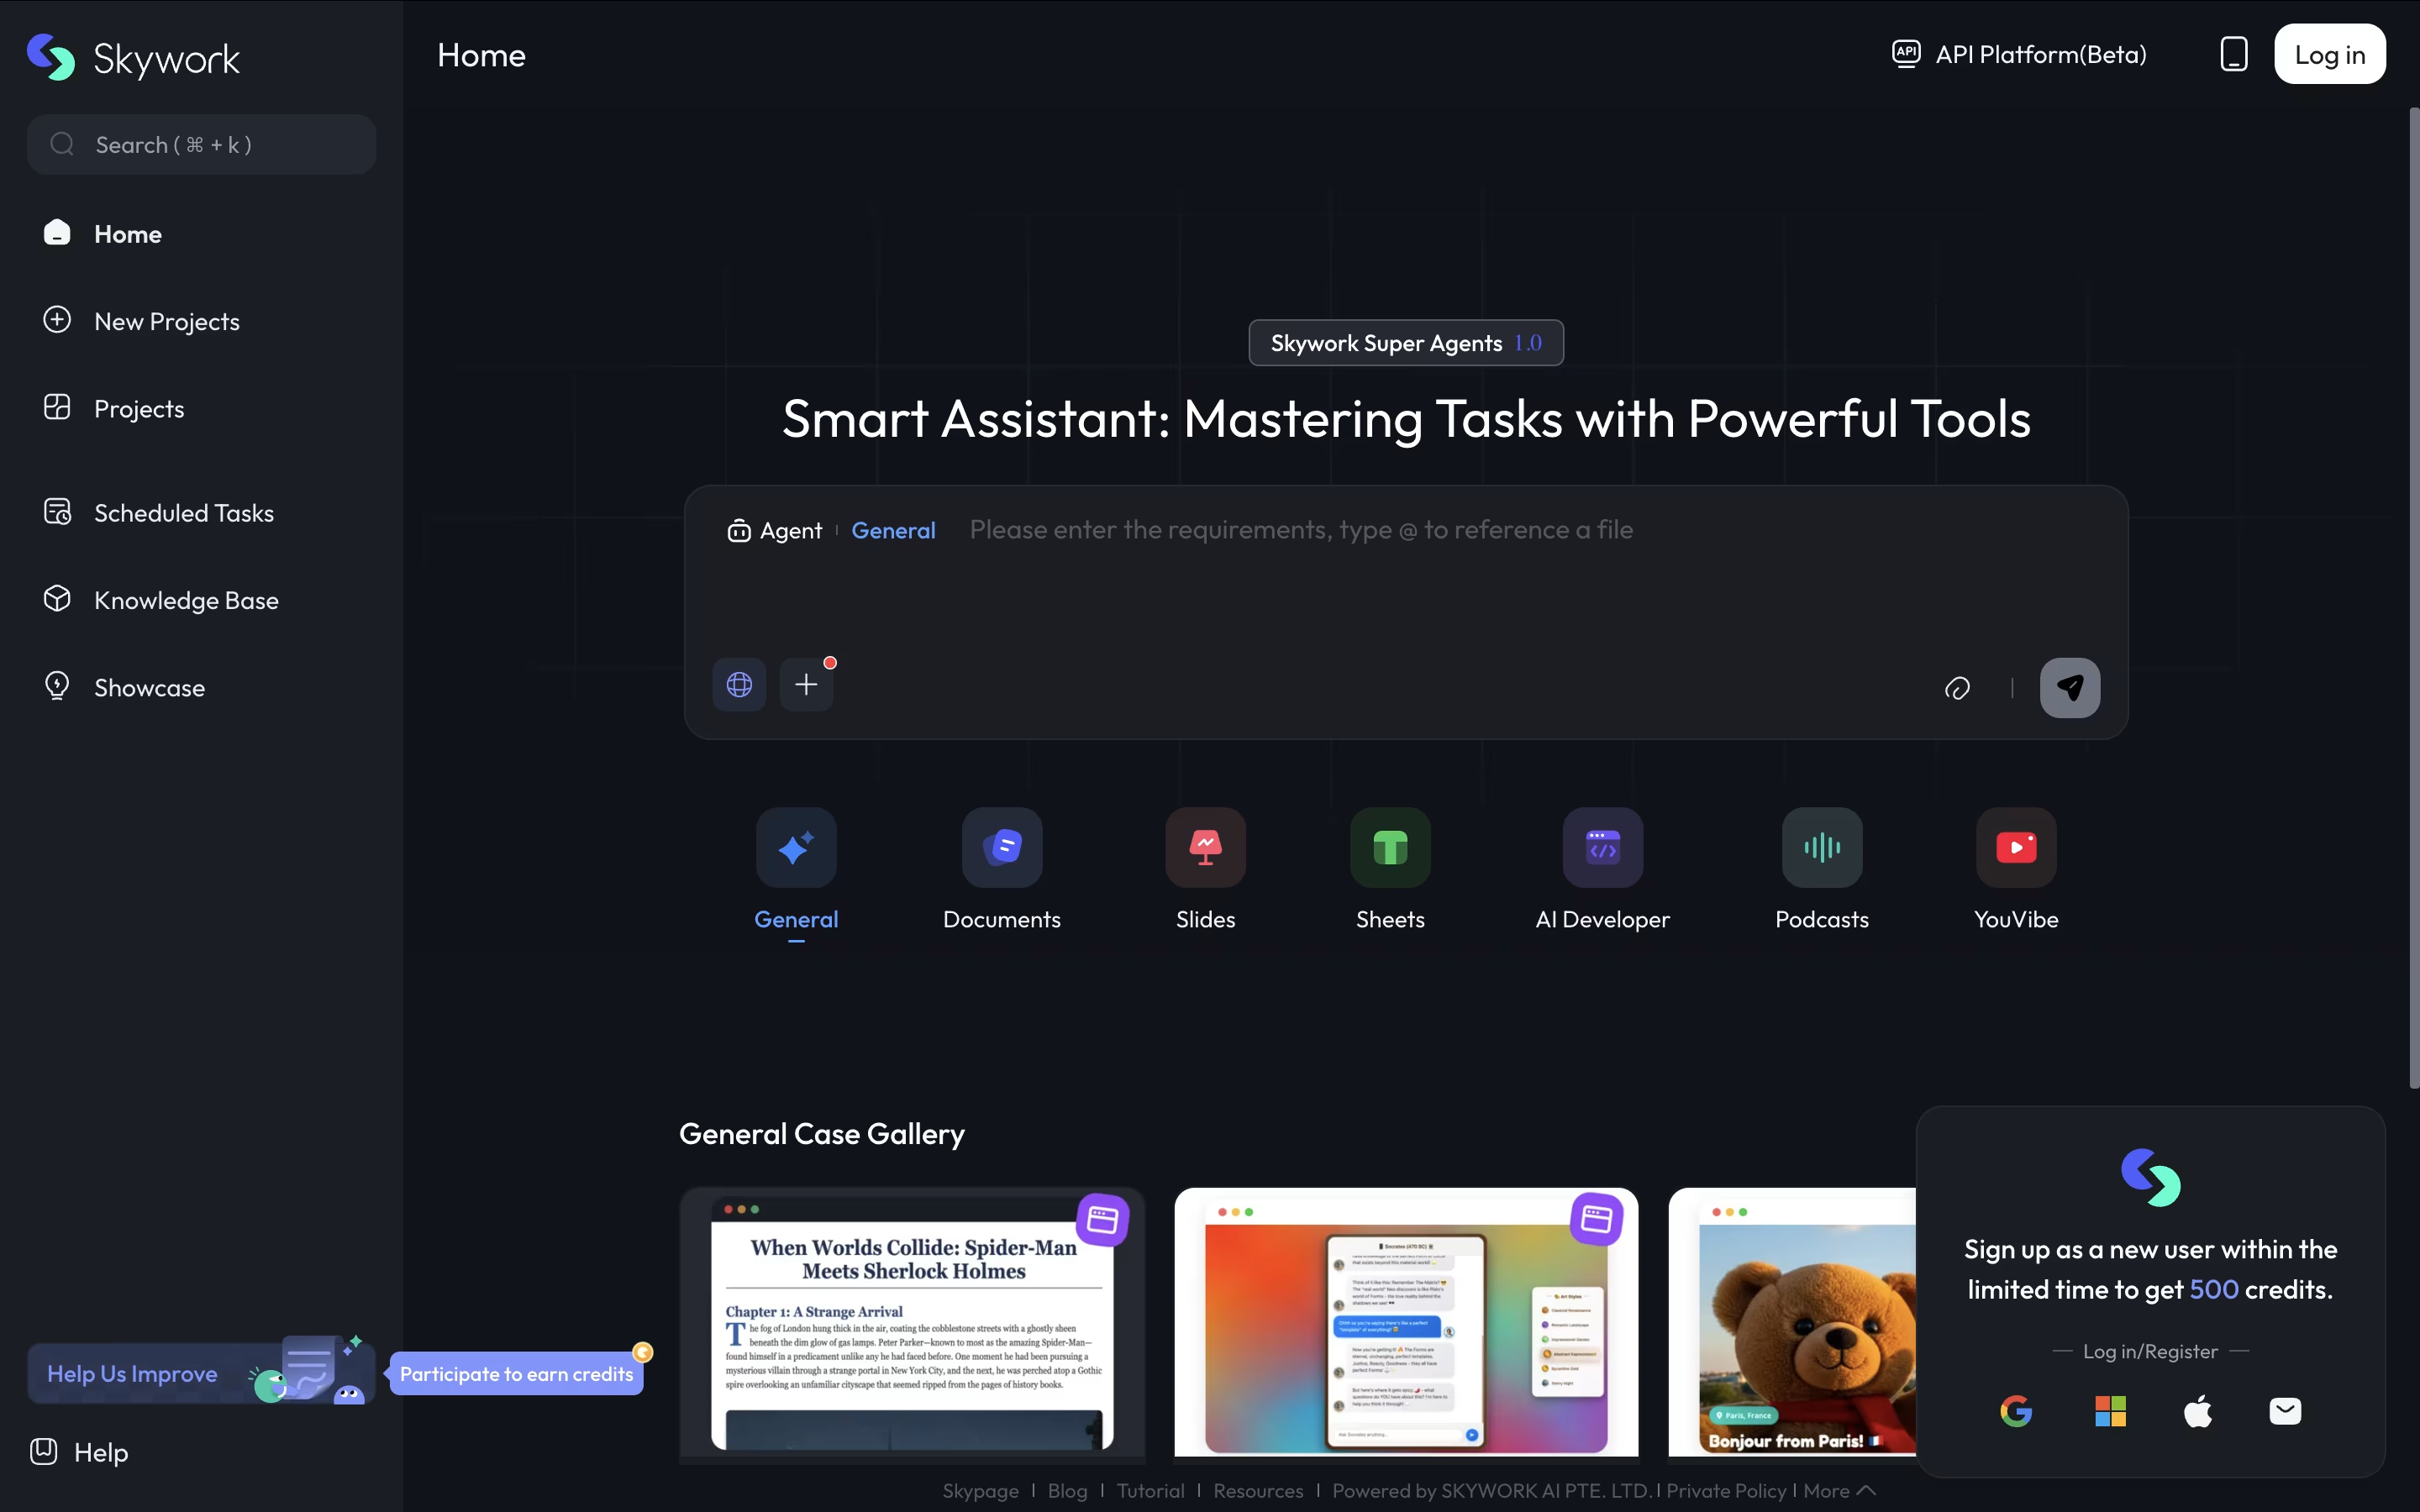
The platform's key strength is its DeepResearch technology, which searches up to 30+ sources compared to typical AI tools that use only 5-6 sources. This means your content is more accurate, credible, and properly cited. Skywork can process uploaded files, create knowledge bases from your documents, and generate content that's ready to use professionally.
It uses a credit-based system where you pay only for what you use, making it cost-effective for both occasional users and power users who need regular content creation.

Cube.js is a universal semantic layer that sits between your data sources and applications. Think of it as a smart middleware that connects to data warehouses like Snowflake, BigQuery, or Postgres and transforms raw data into business-ready metrics and dimensions.
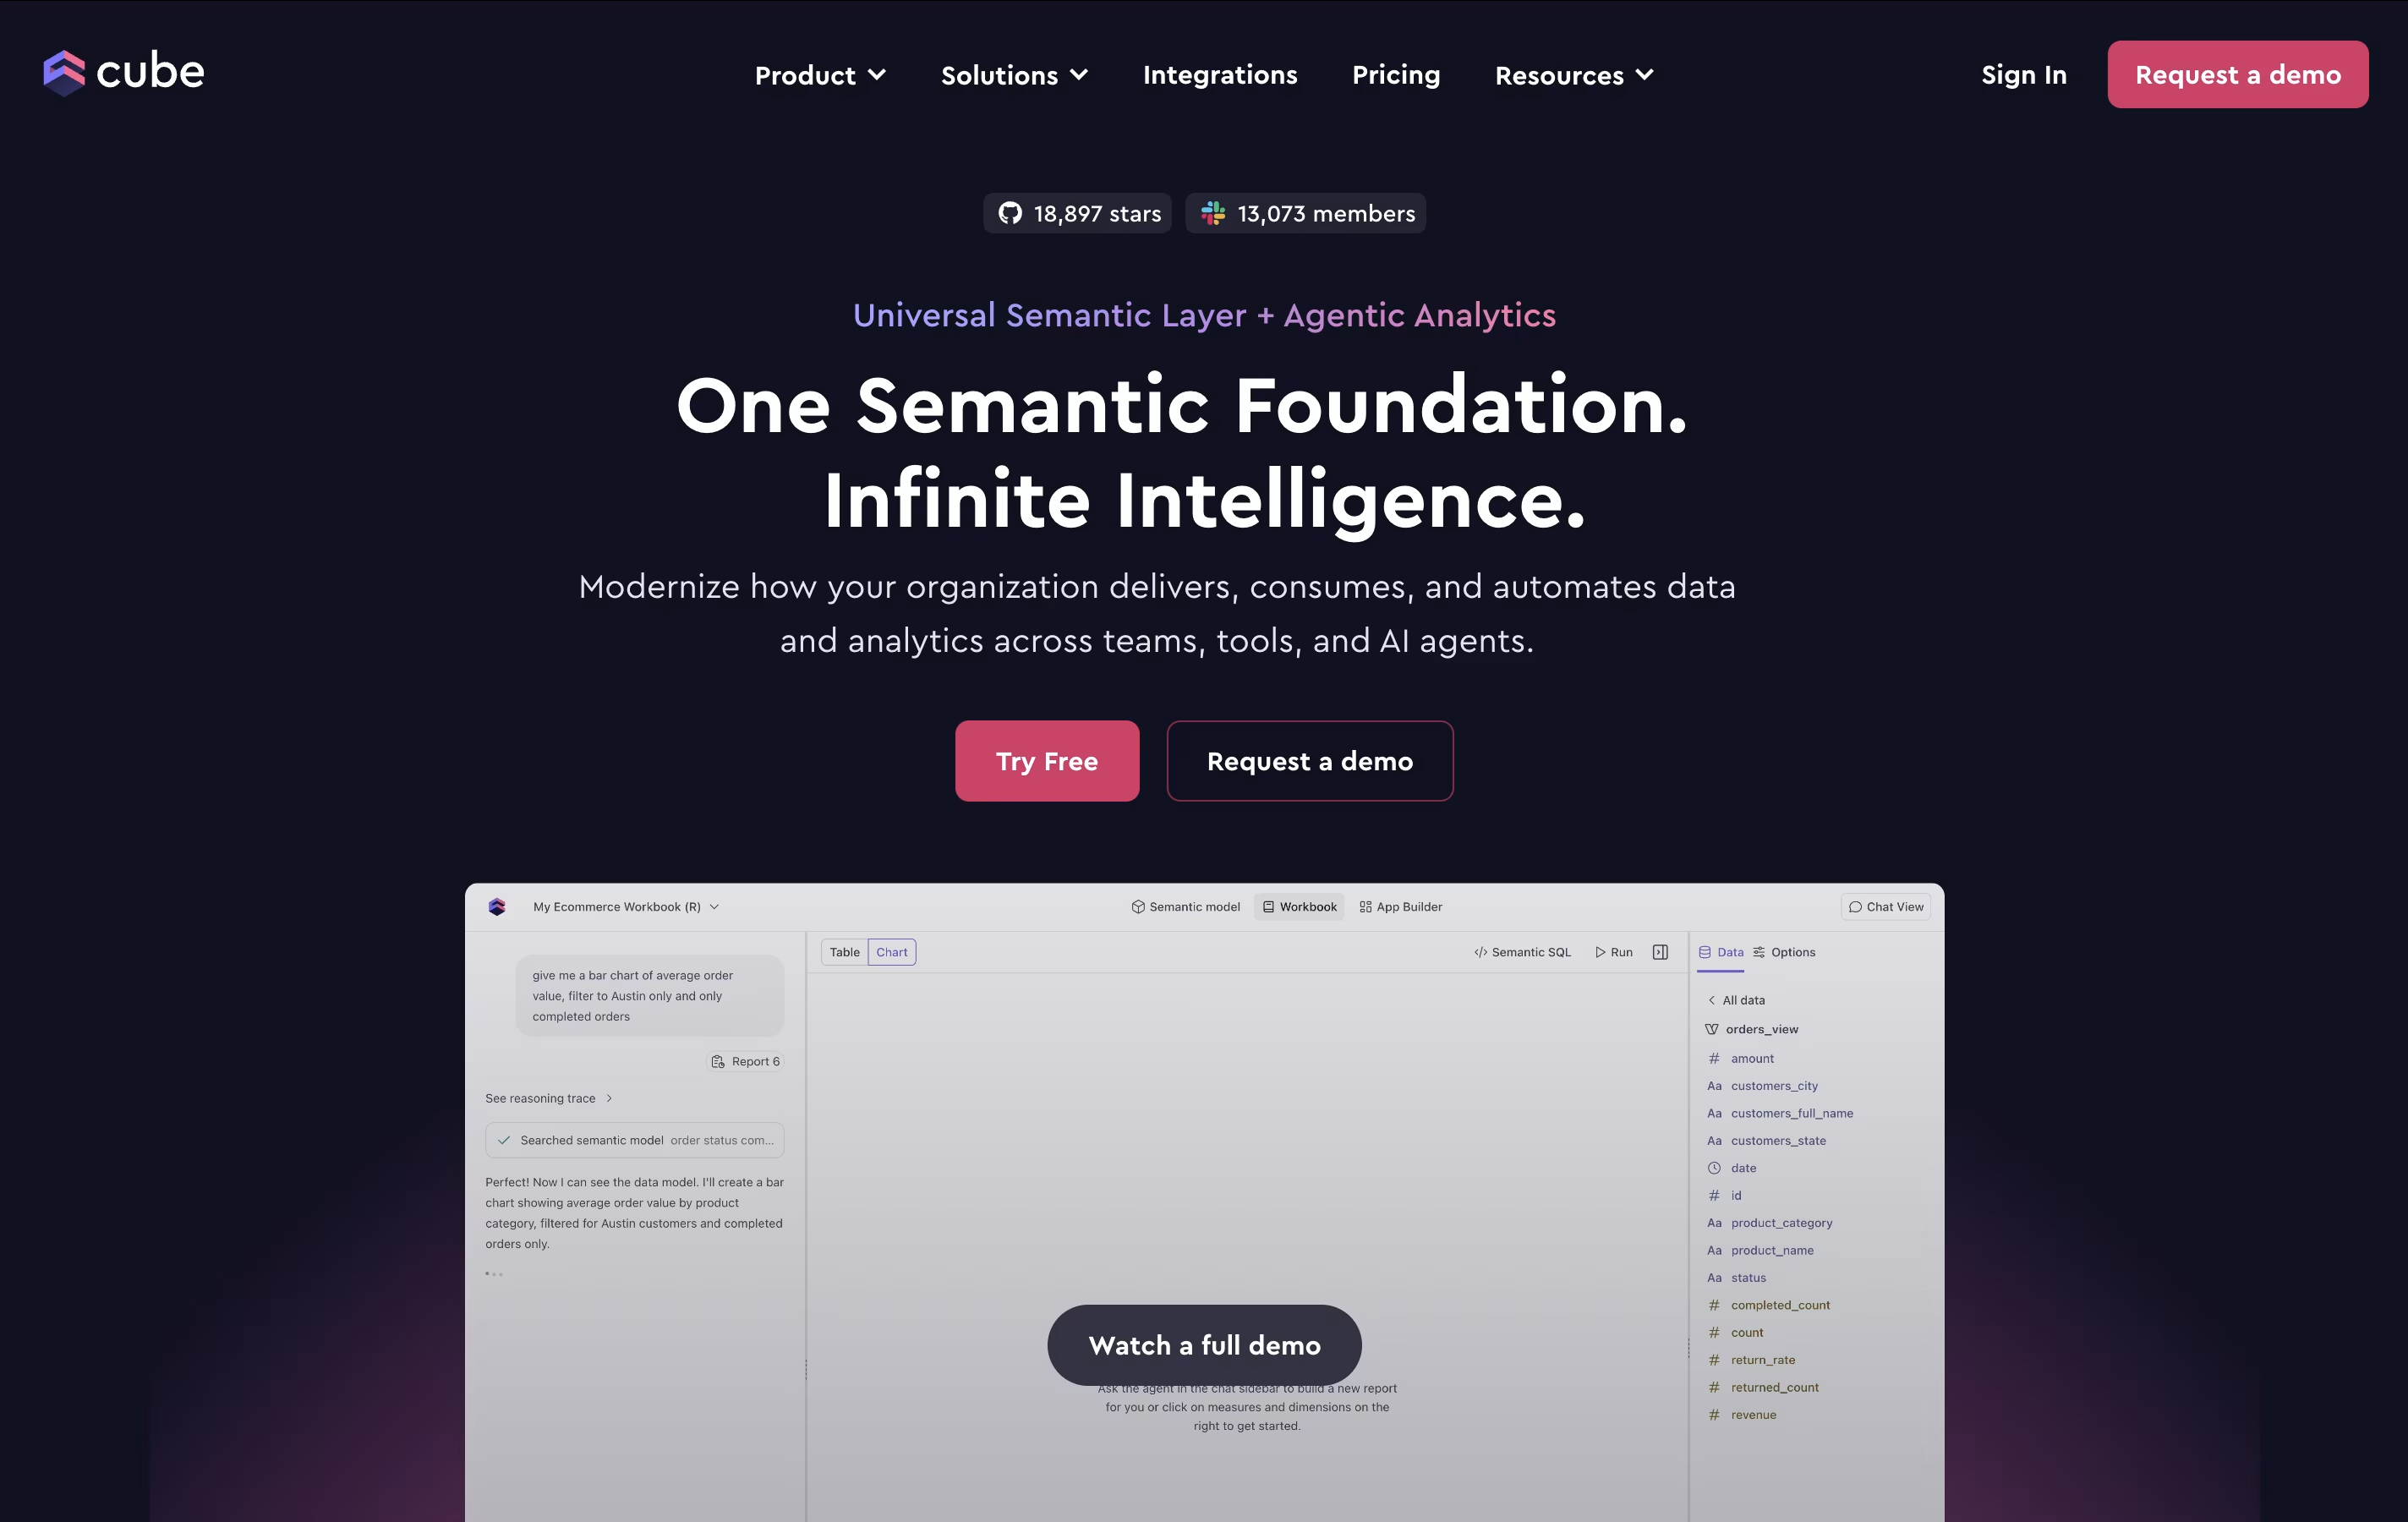
Unlike traditional BI tools that lock you into specific interfaces, Cube.js provides flexible APIs that work with any application or tool. You define your data model once using code, and Cube.js automatically generates optimized SQL queries, handles caching for faster performance, and provides consistent results across all your applications.
The platform consists of two main offerings: Cube Core (open-source) for self-hosting and Cube Cloud (managed service) with additional enterprise features. Both versions support the same core functionality but Cube Cloud includes hosting, security features, and integrations with popular BI tools like Tableau and Power BI.

Baremetrics is a subscription analytics platform that transforms raw payment data into clear business insights. When you connect your payment processor, it automatically calculates over 20+ important metrics including Monthly Recurring Revenue, Annual Run Rate, customer churn, and average revenue per user.
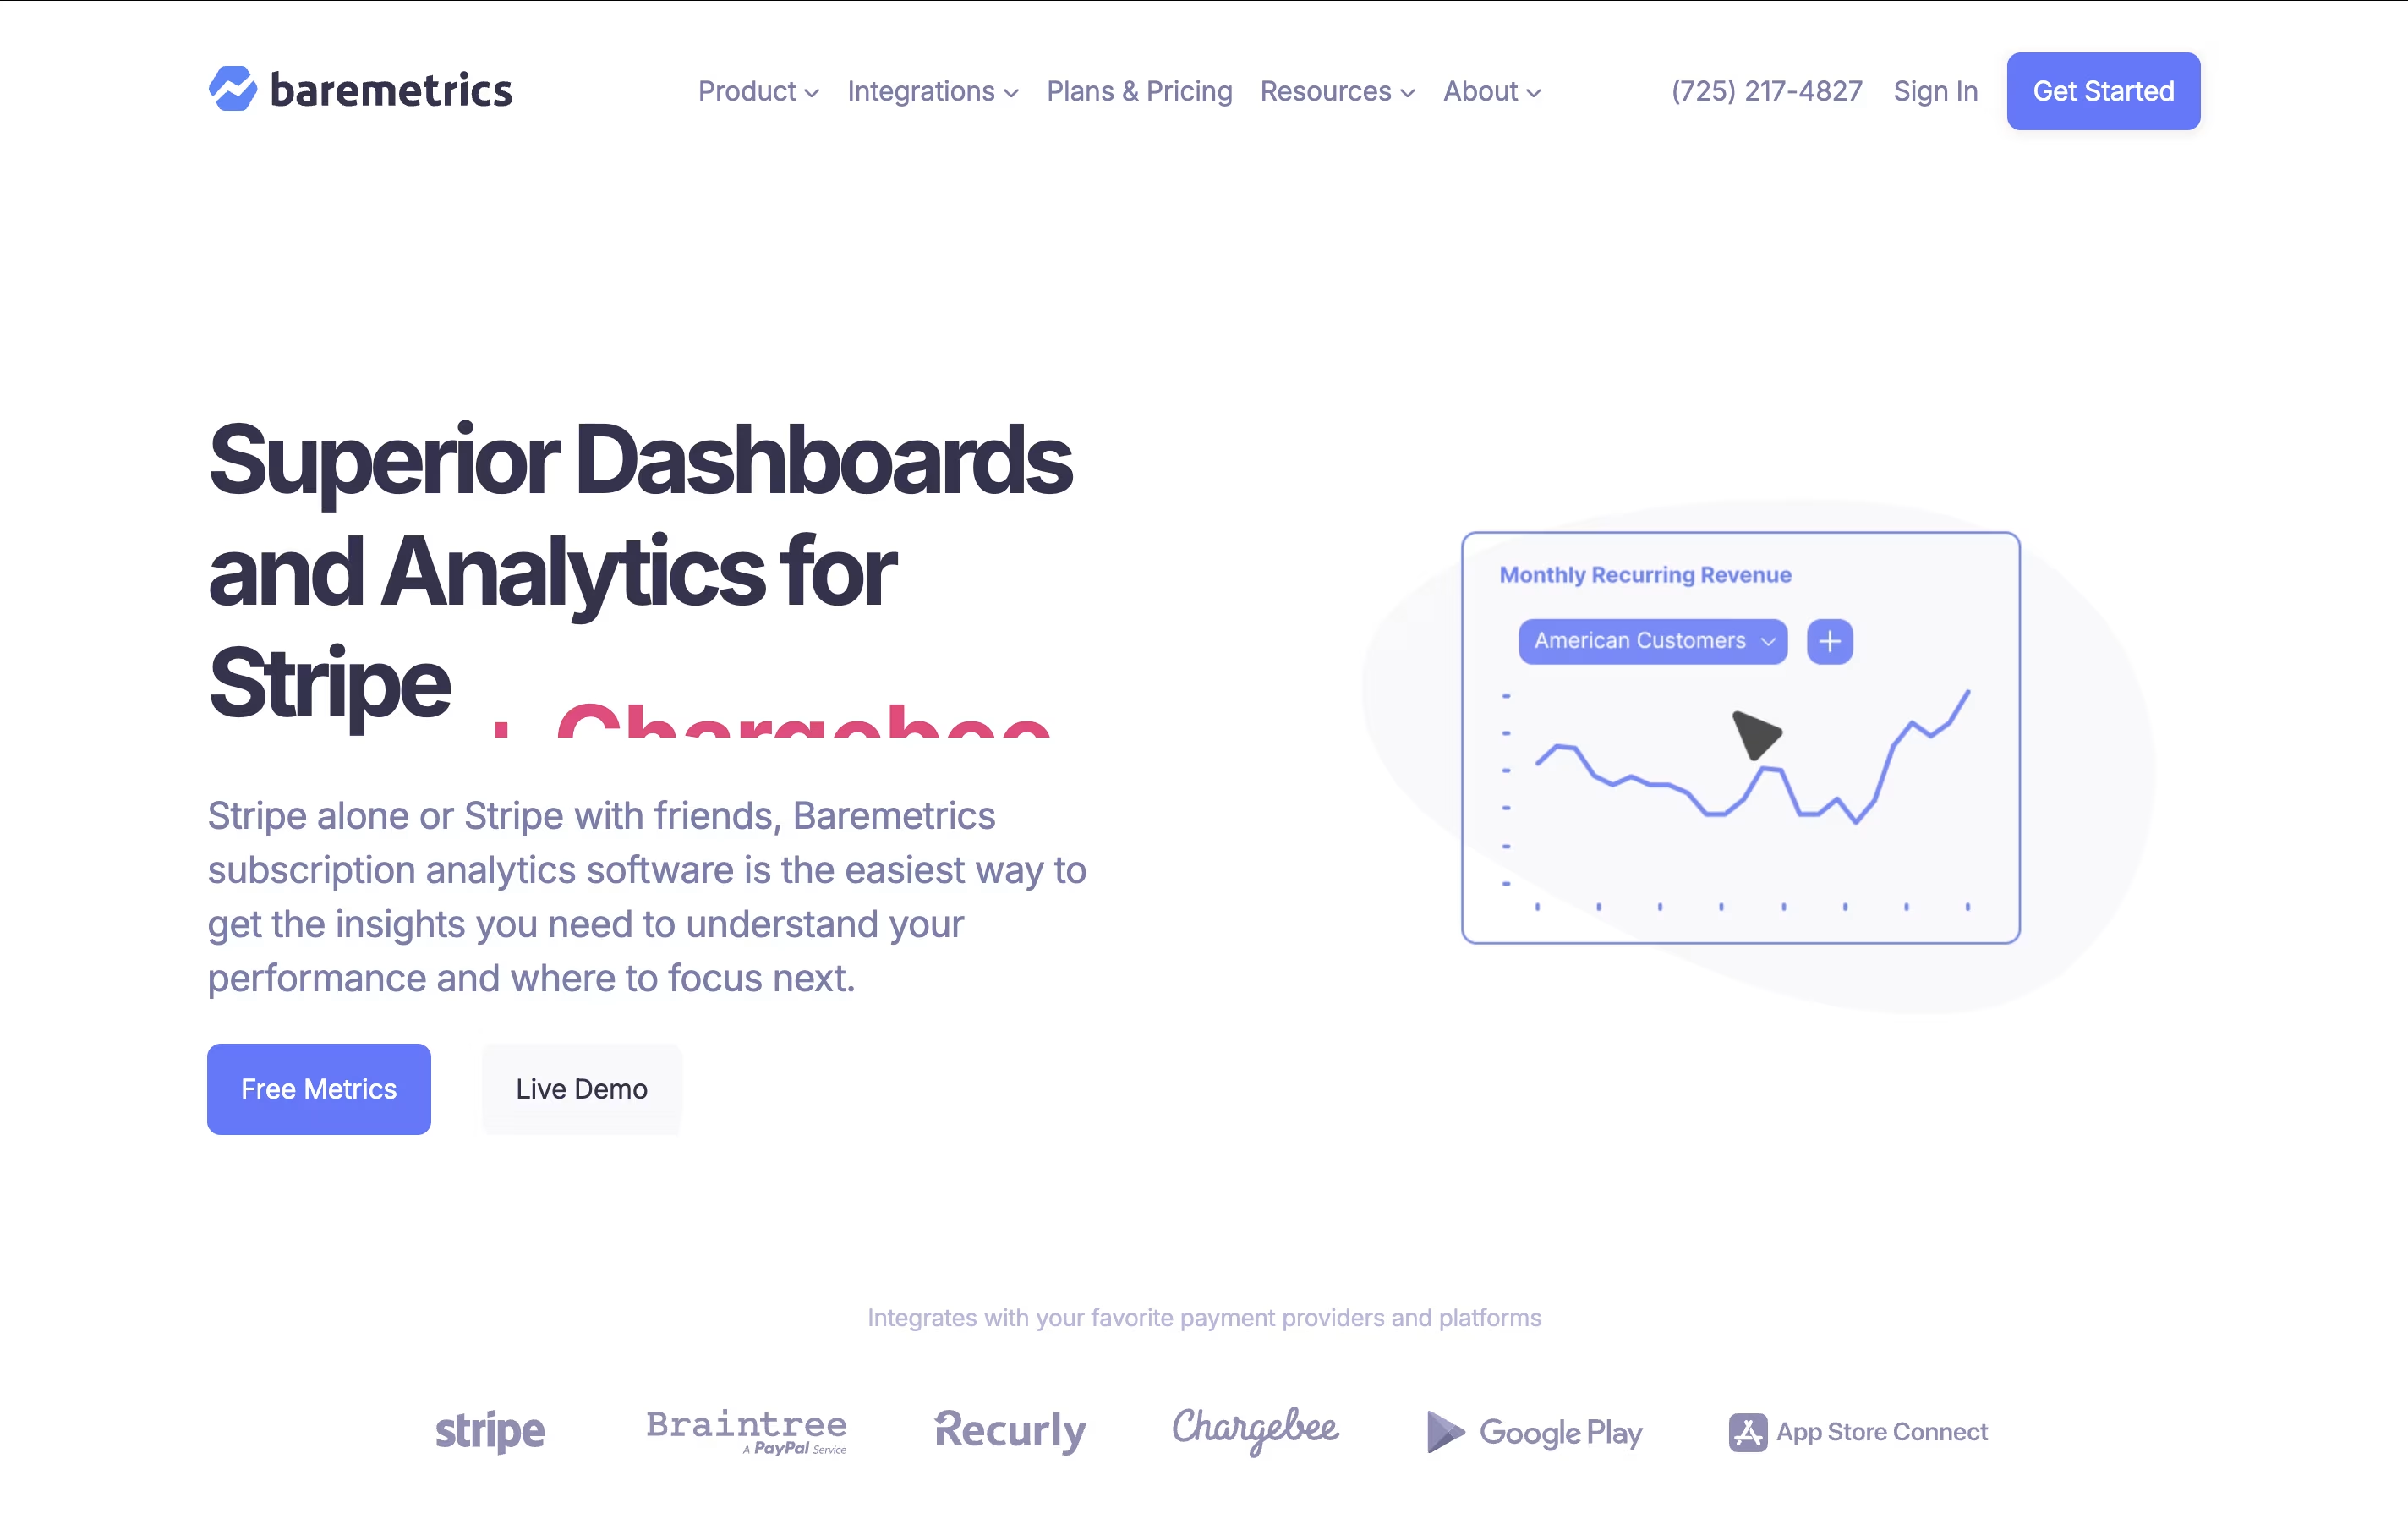
Unlike general analytics tools, Baremetrics is designed specifically for subscription businesses, so every feature addresses the unique challenges of recurring revenue models. The platform provides real-time dashboards that show what is happening with your business today, forecasting tools to plan for tomorrow, and historical data to understand trends.
Baremetrics works with popular payment processors like Stripe, Braintree, Recurly, and Chargebee. It offers modular pricing where you only pay for the features you need, including core metrics, failed payment recovery, and cancellation insights to reduce customer churn.

Coupler.io is a "no-code data integration and automation platform" that connects different business applications to create unified reports and dashboards. It acts as a bridge between your marketing tools, sales software, accounting systems, and reporting platforms.
The tool automatically pulls data from sources like Google Analytics, HubSpot, Xero, and social media platforms, then sends it to destinations like Google Sheets, Excel, Power BI, or Looker Studio. This happens on a schedule you set, so your reports stay fresh without manual work.
What makes it special is its ability to transform and combine data from multiple sources, creating custom reports that update themselves. This helps businesses track performance, spot trends, and make data-driven decisions faster than traditional manual reporting methods.

FullStory is a digital experience intelligence platform that automatically captures and analyzes user behavior on websites and mobile applications. Think of it as having a security camera for your digital products, but instead of just recording, it understands what's happening.
The platform uses advanced technology to record every user session, showing you exactly how visitors navigate your site, where they click, how they scroll, and what causes them to leave. Unlike basic analytics that only show numbers, FullStory provides the context behind those numbers through session replays and behavioral insights.
FullStory serves businesses of all sizes, from startups to large enterprises, helping product teams, marketers, UX designers, and customer support staff understand their users better. With features like automatic error detection, conversion funnels, and AI-powered analysis, it turns user behavior data into actionable insights for improving digital experiences.