

Best 9 Tools for Report Writing in 2026
Last Updated: November 7, 2025
Turning raw data and notes into a clear, readable report can eat up hours that could be spent elsewhere. Report Writing tools help structure findings, summarize key points, and format the final document so it is ready to share with stakeholders.
Analysts, consultants, and project managers rely on these tools to produce consistent, professional reports on a recurring basis without rebuilding the format from scratch every time.
 Usermaven
 UsermavenSimple Privacy-Friendly Analytics Platform,
  Skywork AI
 Skywork AISmart Content Creation Super Agents, and
  Piktochart
 PiktochartAI-Powered Infographic & Visual Content Maker are the best for Report Writing. So, let’s take a closer look at all 9 tools.
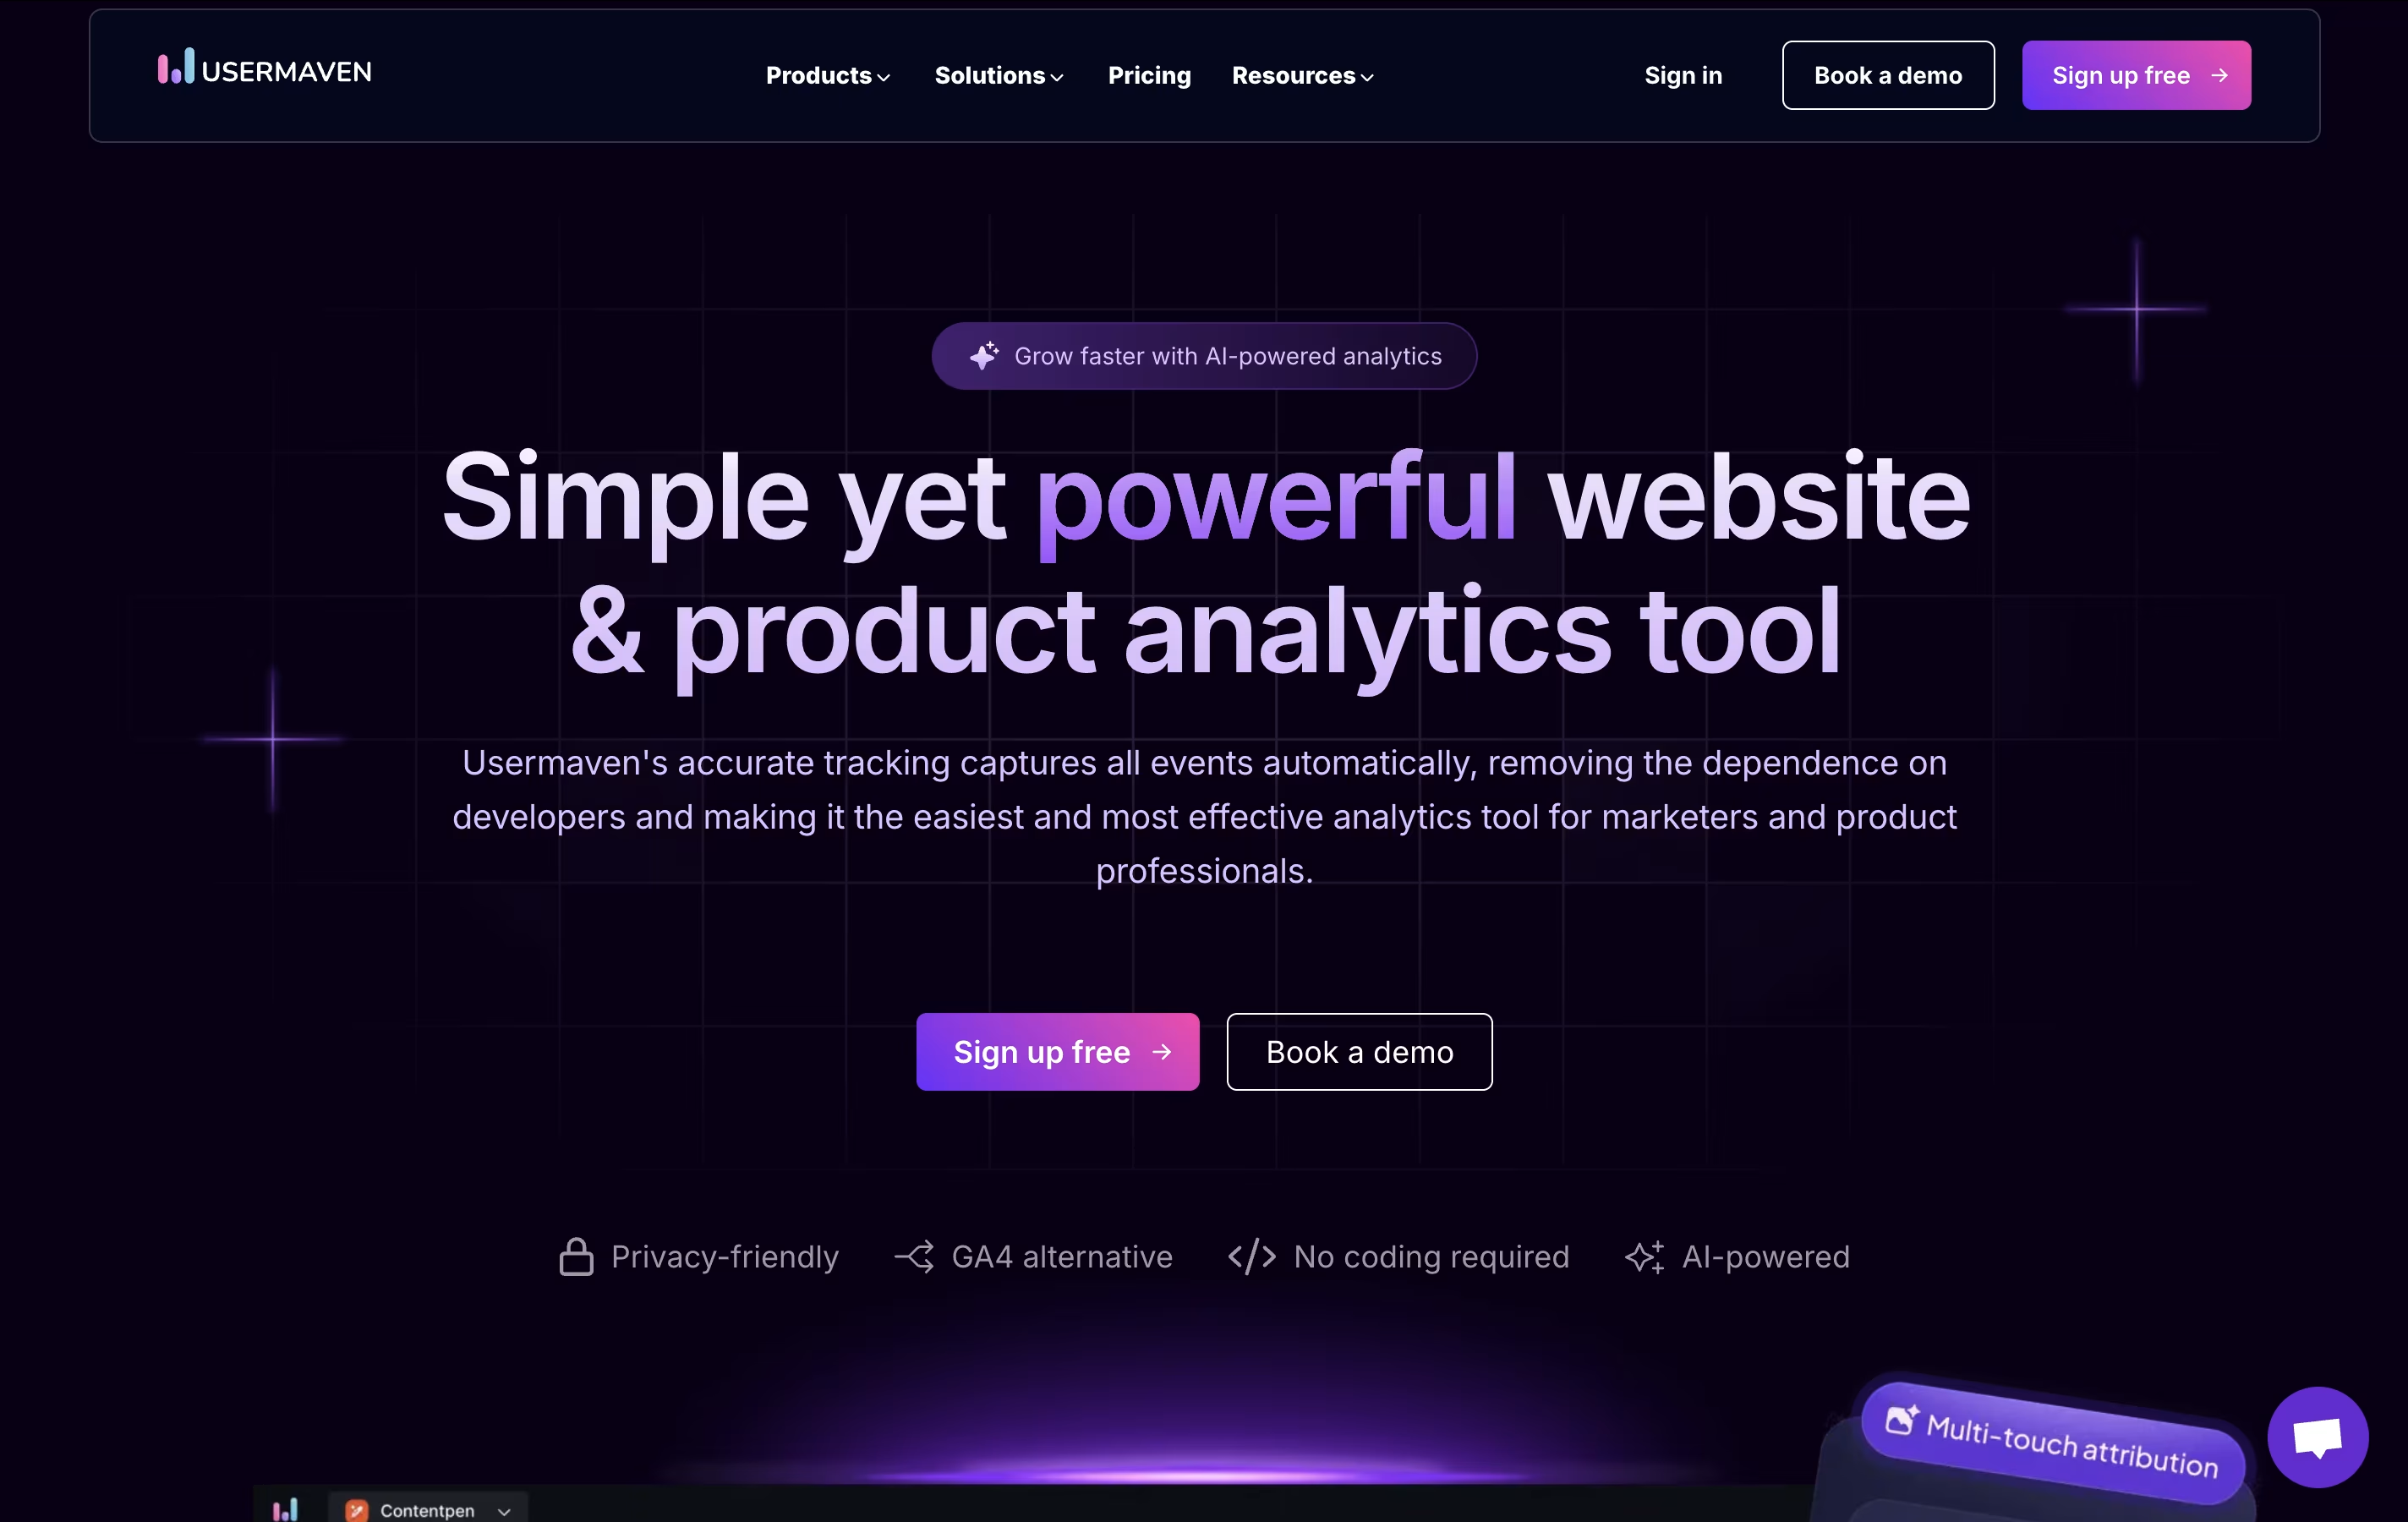
Usermaven is a privacy-focused analytics platform that provides both website analytics and product analytics in one simple tool. Founded in 2021, this cloud-based solution serves as a smart alternative to Google Analytics, focusing on ease of use and privacy compliance.
The platform automatically captures user interactions like clicks, form submissions, and page visits without requiring any coding knowledge. What makes Usermaven special is its commitment to privacy – it offers cookieless tracking, hosts data in EU servers, and fully complies with GDPR and CCPA regulations.
Usermaven combines the power of advanced analytics with AI-driven insights to help businesses understand user behavior, track marketing campaigns, and improve product adoption. The tool serves everyone from small business owners to large enterprises, providing clear, actionable data that helps make better business decisions without compromising user privacy.
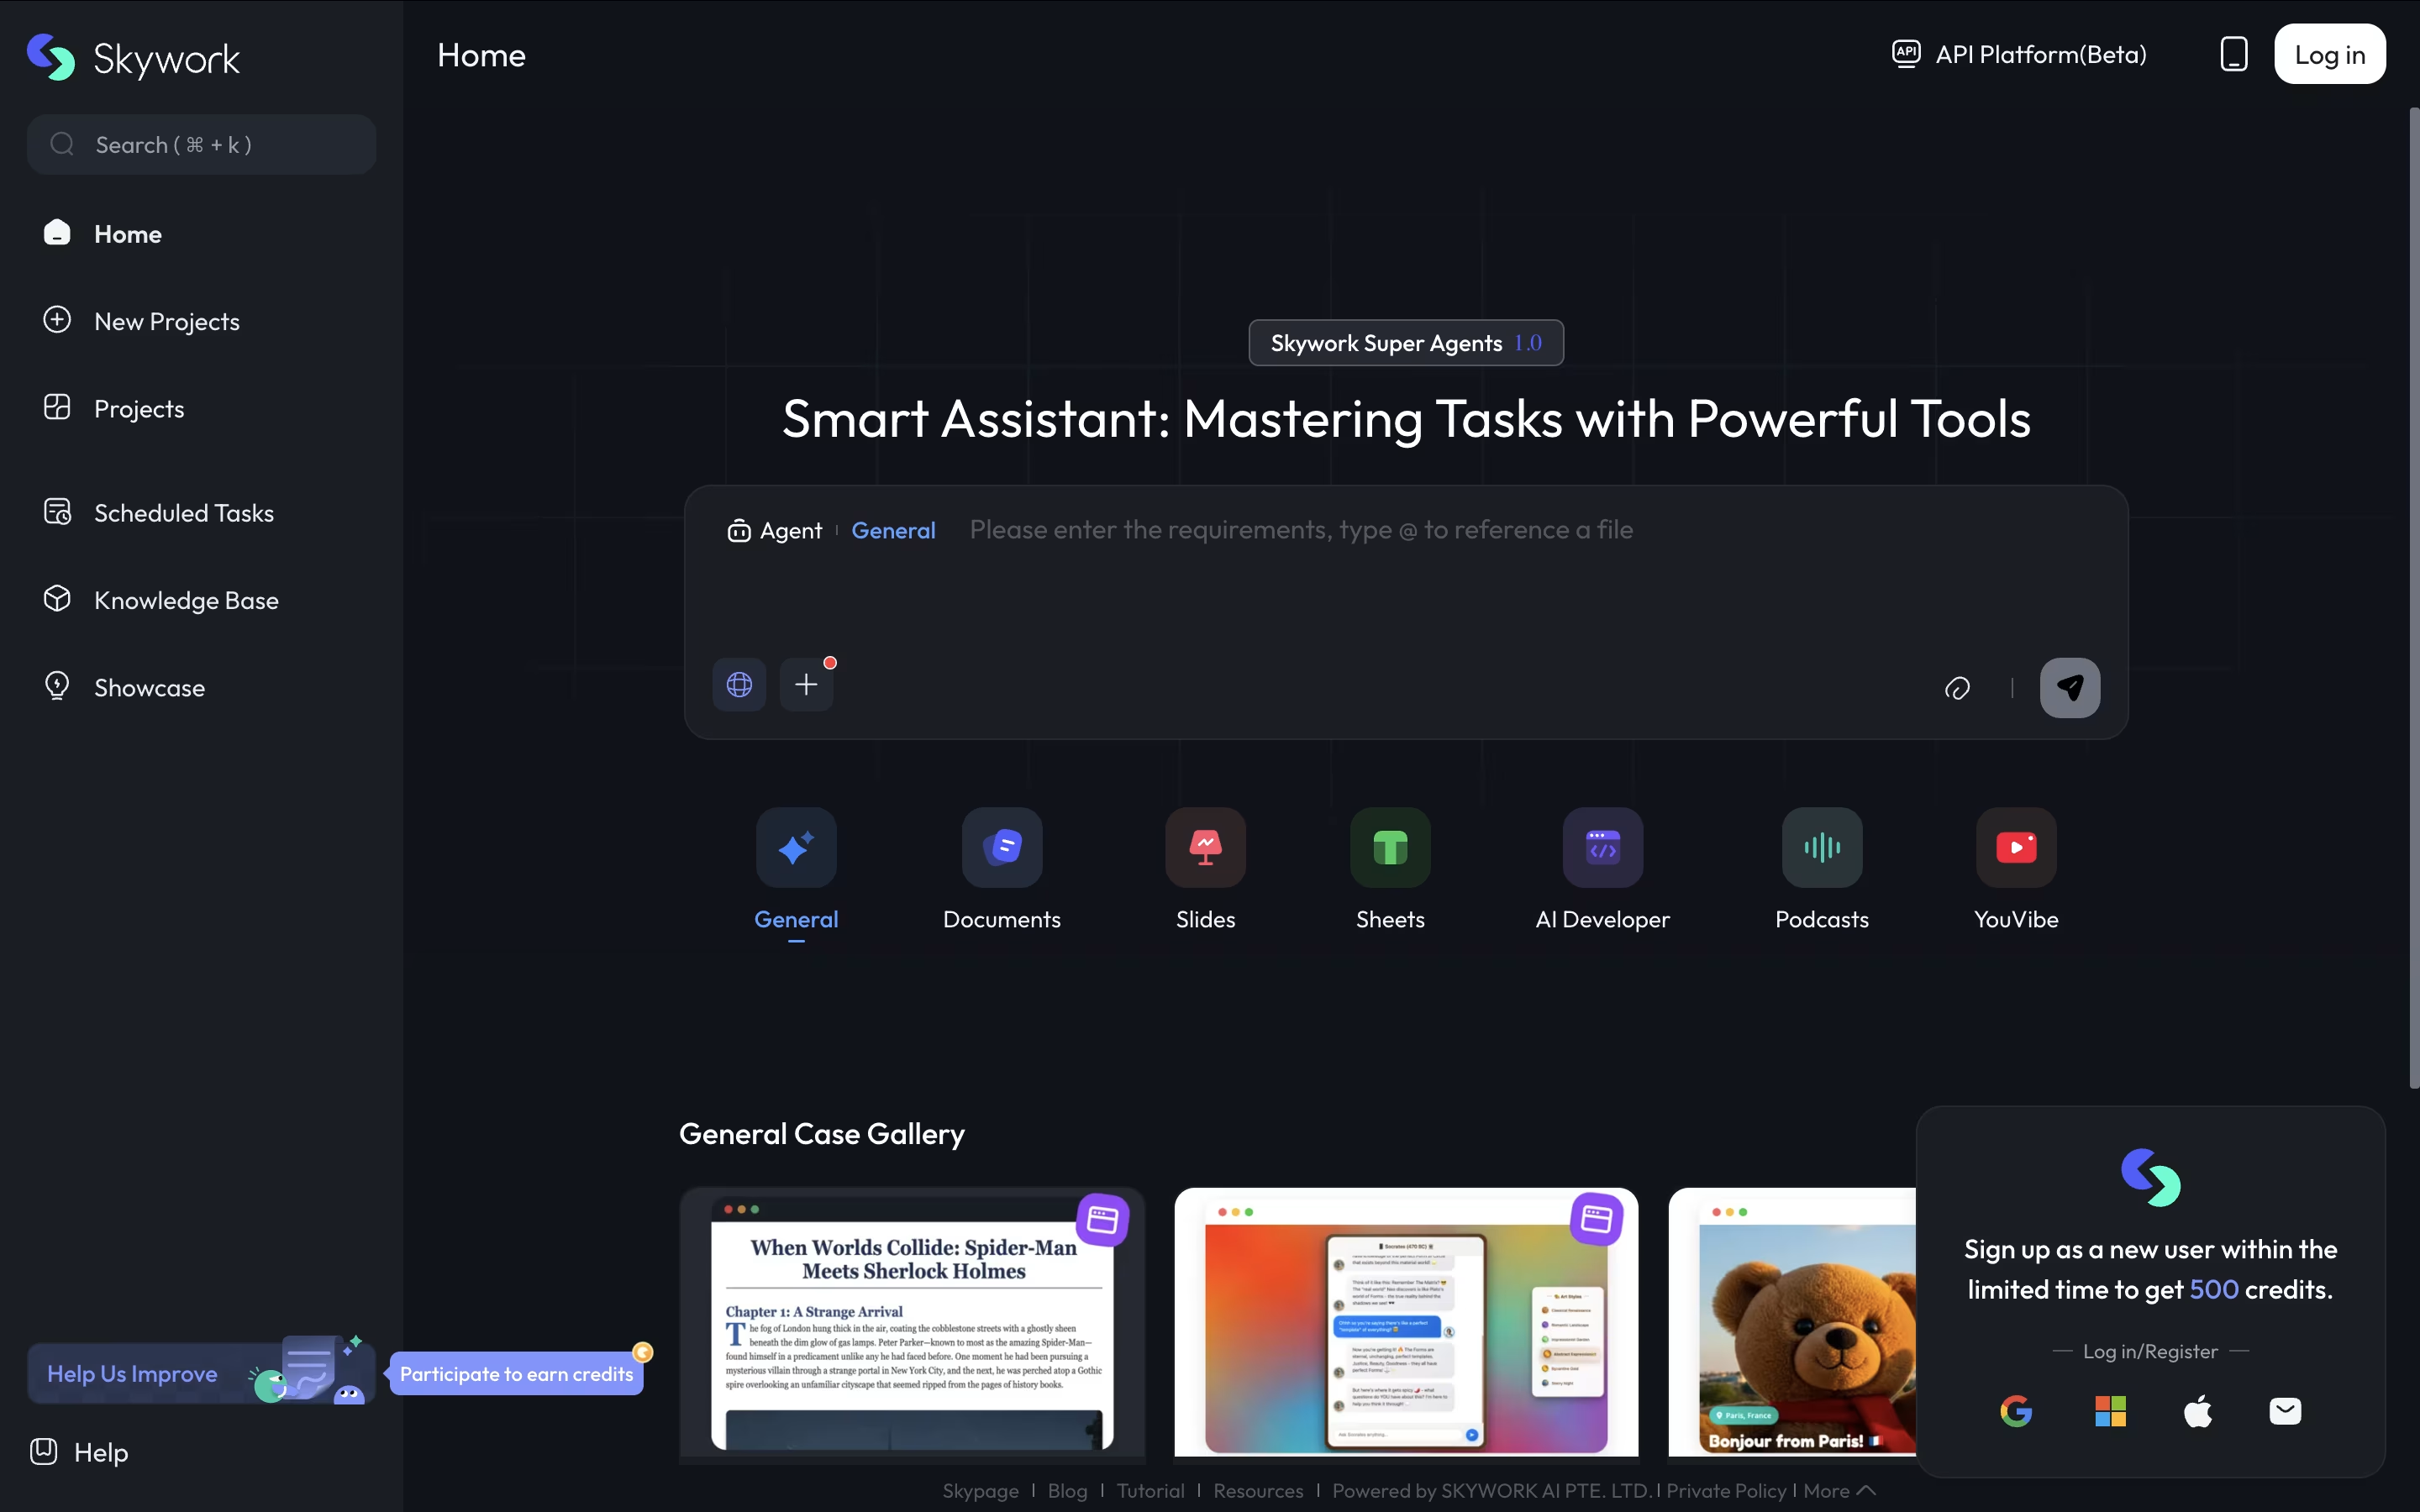
Skywork AI is an AI-powered workspace platform that transforms simple ideas into complete, professional content across multiple formats. Unlike basic AI writing tools, Skywork offers specialized agents for specific tasks: Documents Agent for reports and papers, Slides Agent for presentations, Sheets Agent for data analysis, Podcast Agent for audio content, and Web Agent for creating websites.
The platform's key strength is its DeepResearch technology, which searches up to 30+ sources compared to typical AI tools that use only 5-6 sources. This means your content is more accurate, credible, and properly cited. Skywork can process uploaded files, create knowledge bases from your documents, and generate content that's ready to use professionally.
It uses a credit-based system where you pay only for what you use, making it cost-effective for both occasional users and power users who need regular content creation.
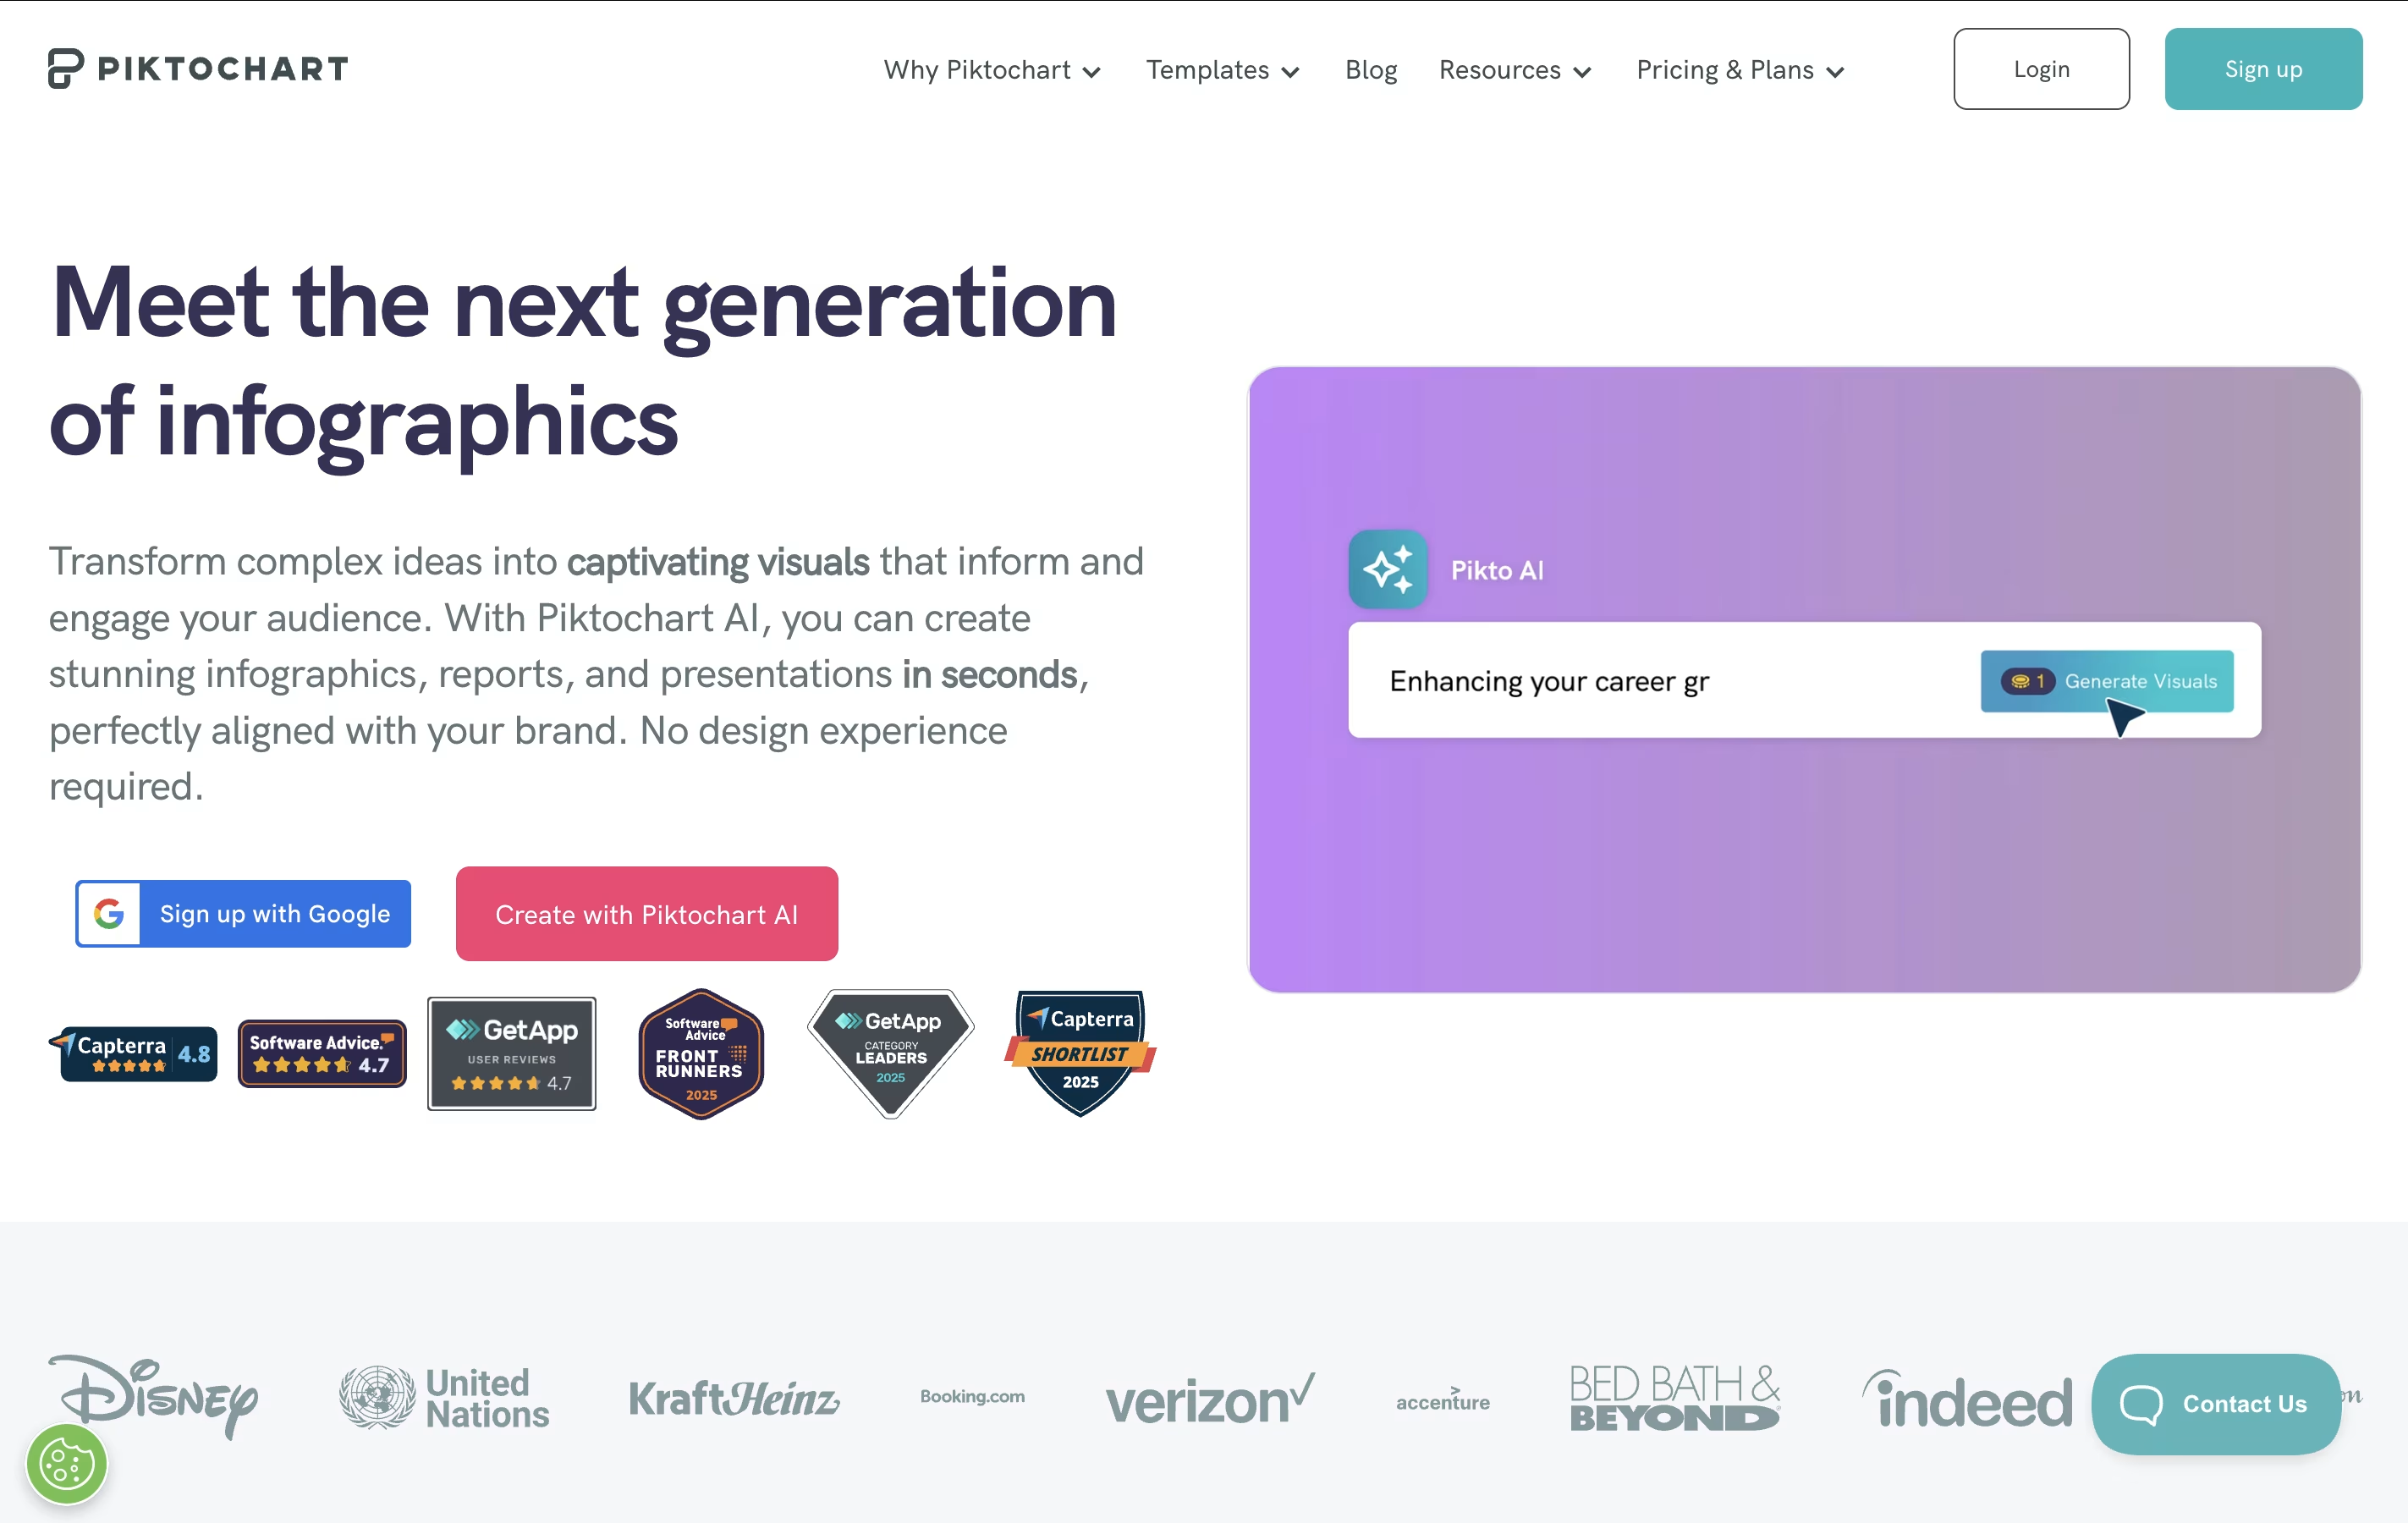
Piktochart is a cloud-based design platform that simplifies visual content creation for non-designers. It offers hundreds of professionally designed templates for infographics, presentations, reports, posters, social media graphics, and more. Users can customize these templates using a drag-and-drop interface without needing graphic design skills.
The platform includes powerful data visualization tools, allowing users to create charts, graphs, maps, and diagrams from their data. It supports importing information from Excel and Google Sheets to automatically generate visuals. Recently, Piktochart added AI features that can generate complete designs from simple text prompts in seconds.
The tool is web-based, meaning everything works through your browser without downloading software. It includes collaboration features for teams, brand customization tools, and various sharing options to publish or download finished designs.

Venngage is a cloud-based visual content creation platform designed to make professional design accessible to everyone. Think of it as your personal design assistant that combines artificial intelligence with thousands of pre-made templates to help you create stunning visuals in minutes.
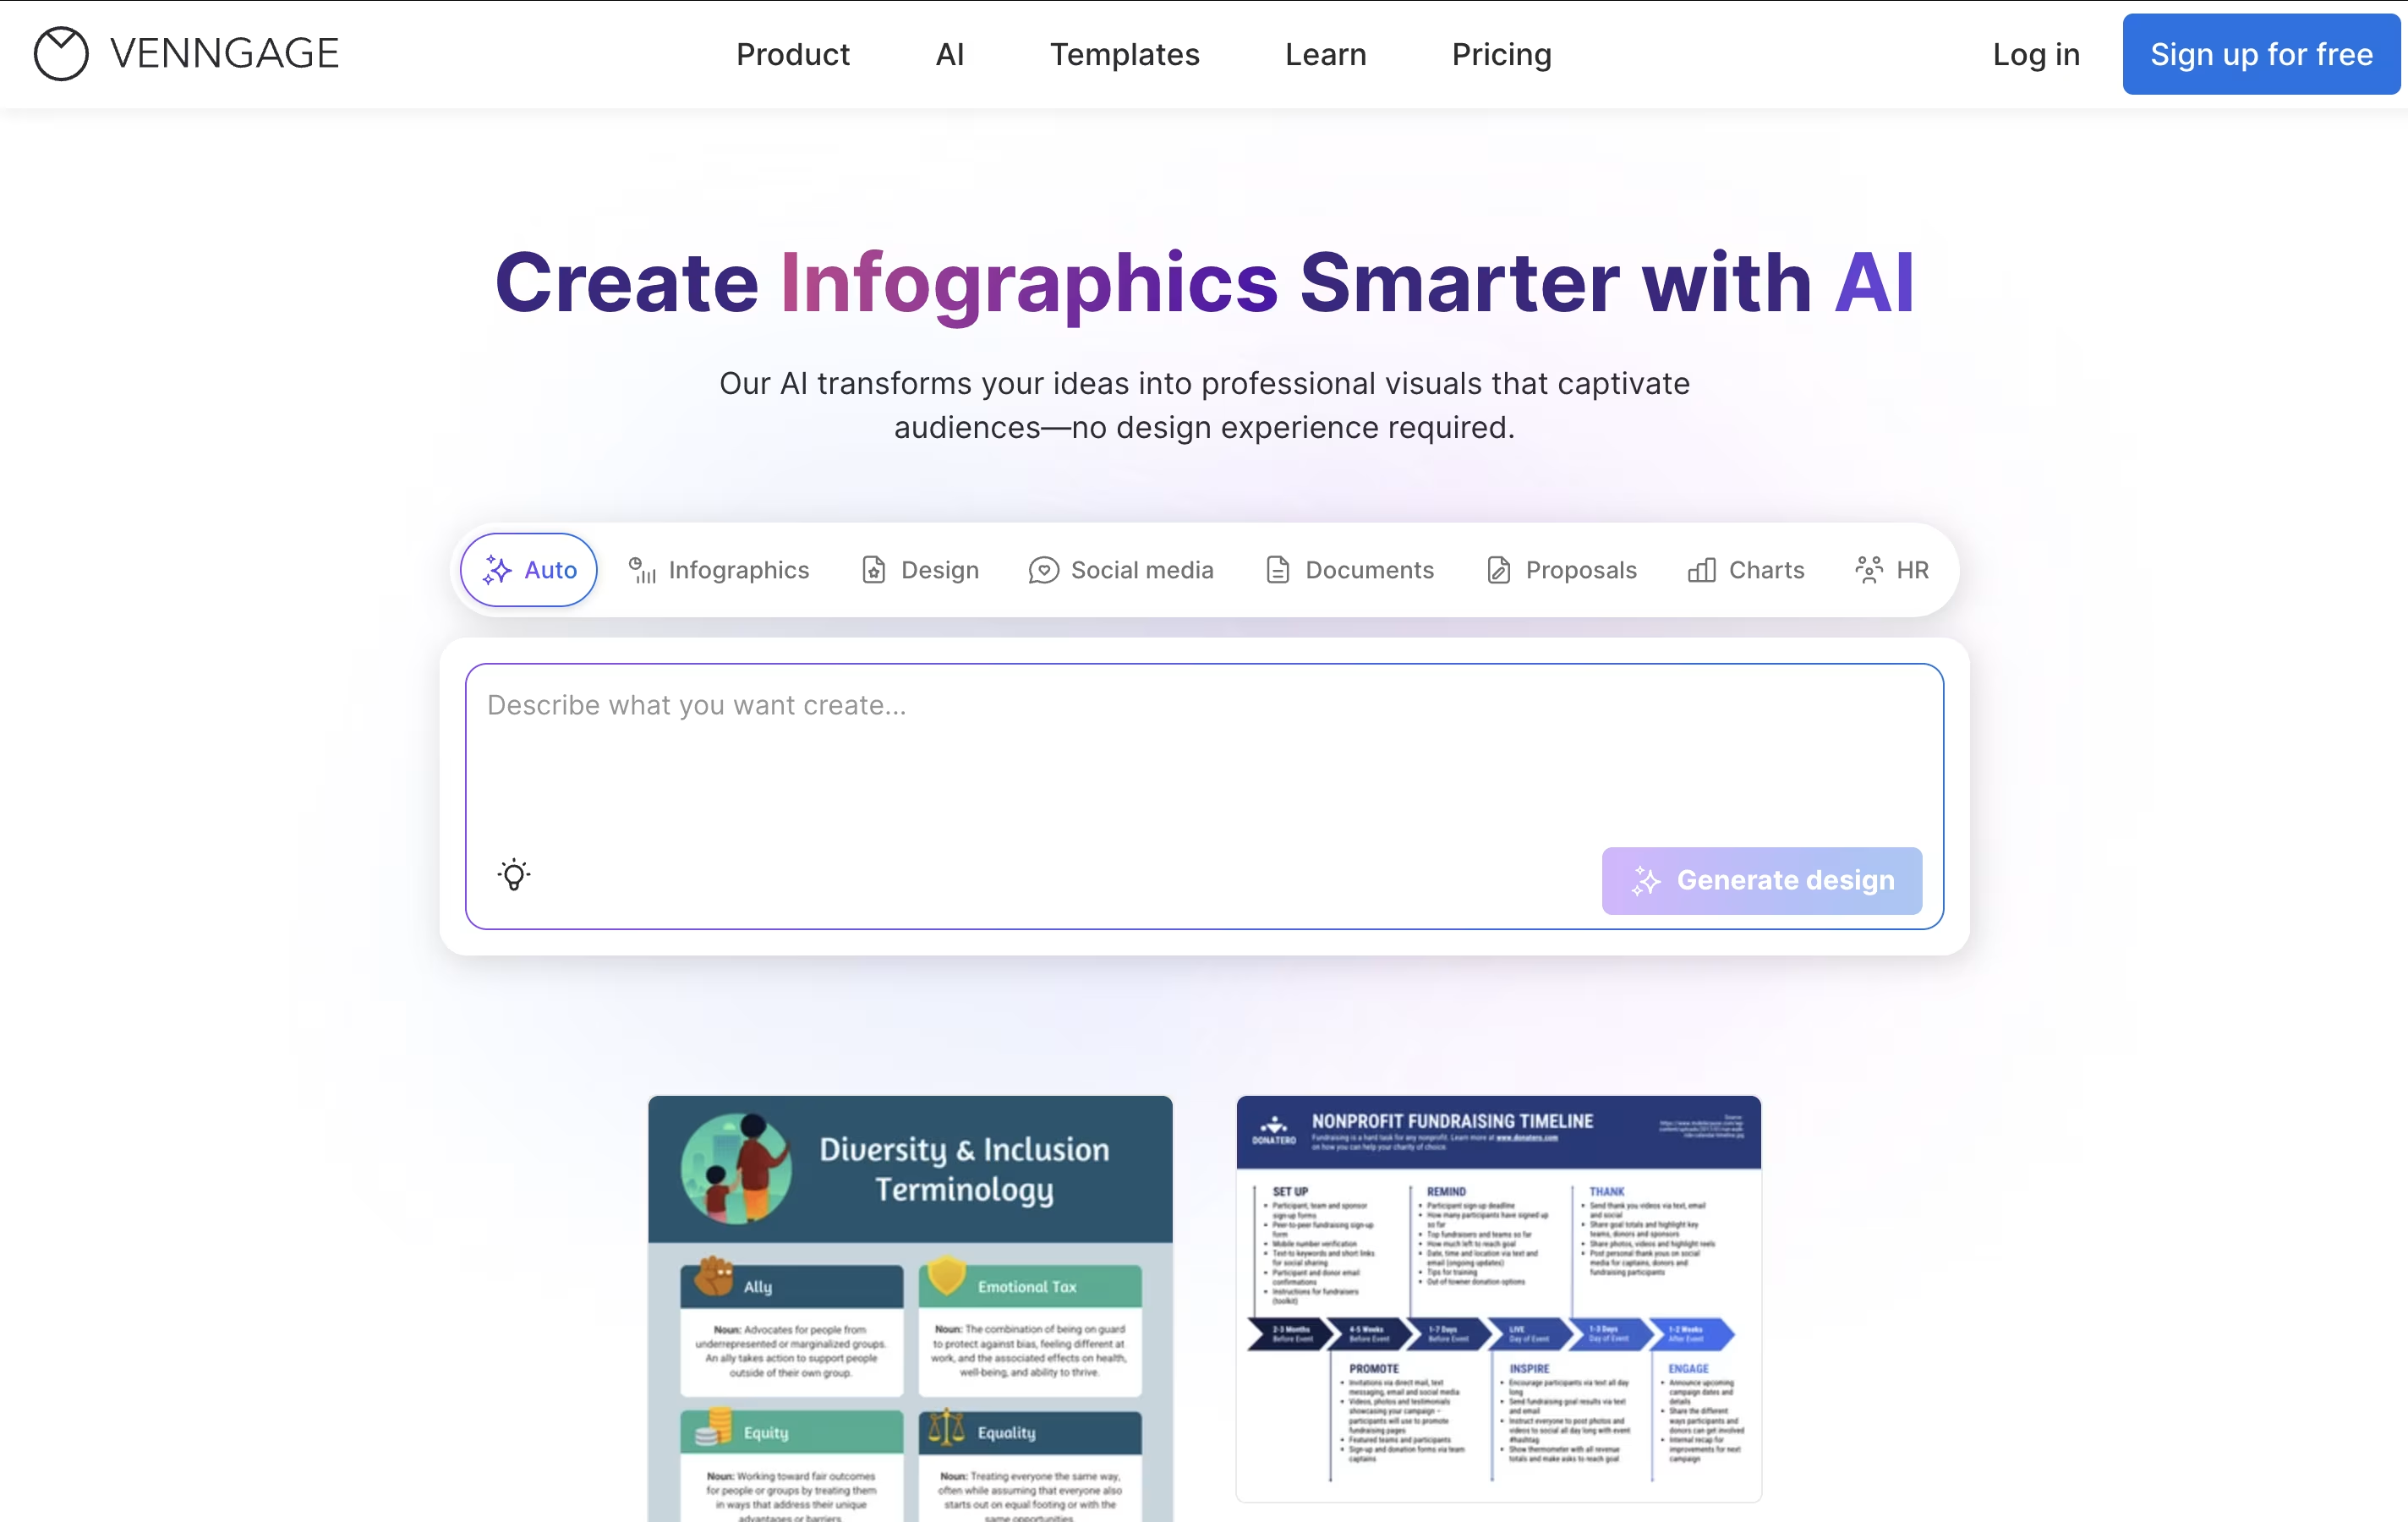
The platform specializes in infographics, presentations, reports, social media graphics, and data visualizations. What sets Venngage apart is its AI-powered approach - you can simply describe what you want, and the AI generates a complete design with proper layouts, colors, and elements. The drag-and-drop editor then lets you customize every detail to match your brand and message.
Founded as a solution for non-designers who need professional-looking graphics, Venngage has grown to serve over 5 million users worldwide. It's particularly popular among marketers, educators, students, and small business owners who need to communicate complex information through clear, engaging visuals without hiring a professional designer.

Storydoc is an AI-powered presentation platform that turns regular slide decks into interactive web experiences. Unlike PowerPoint or Google Slides that create static files, Storydoc builds web-based presentations that feel like modern websites.
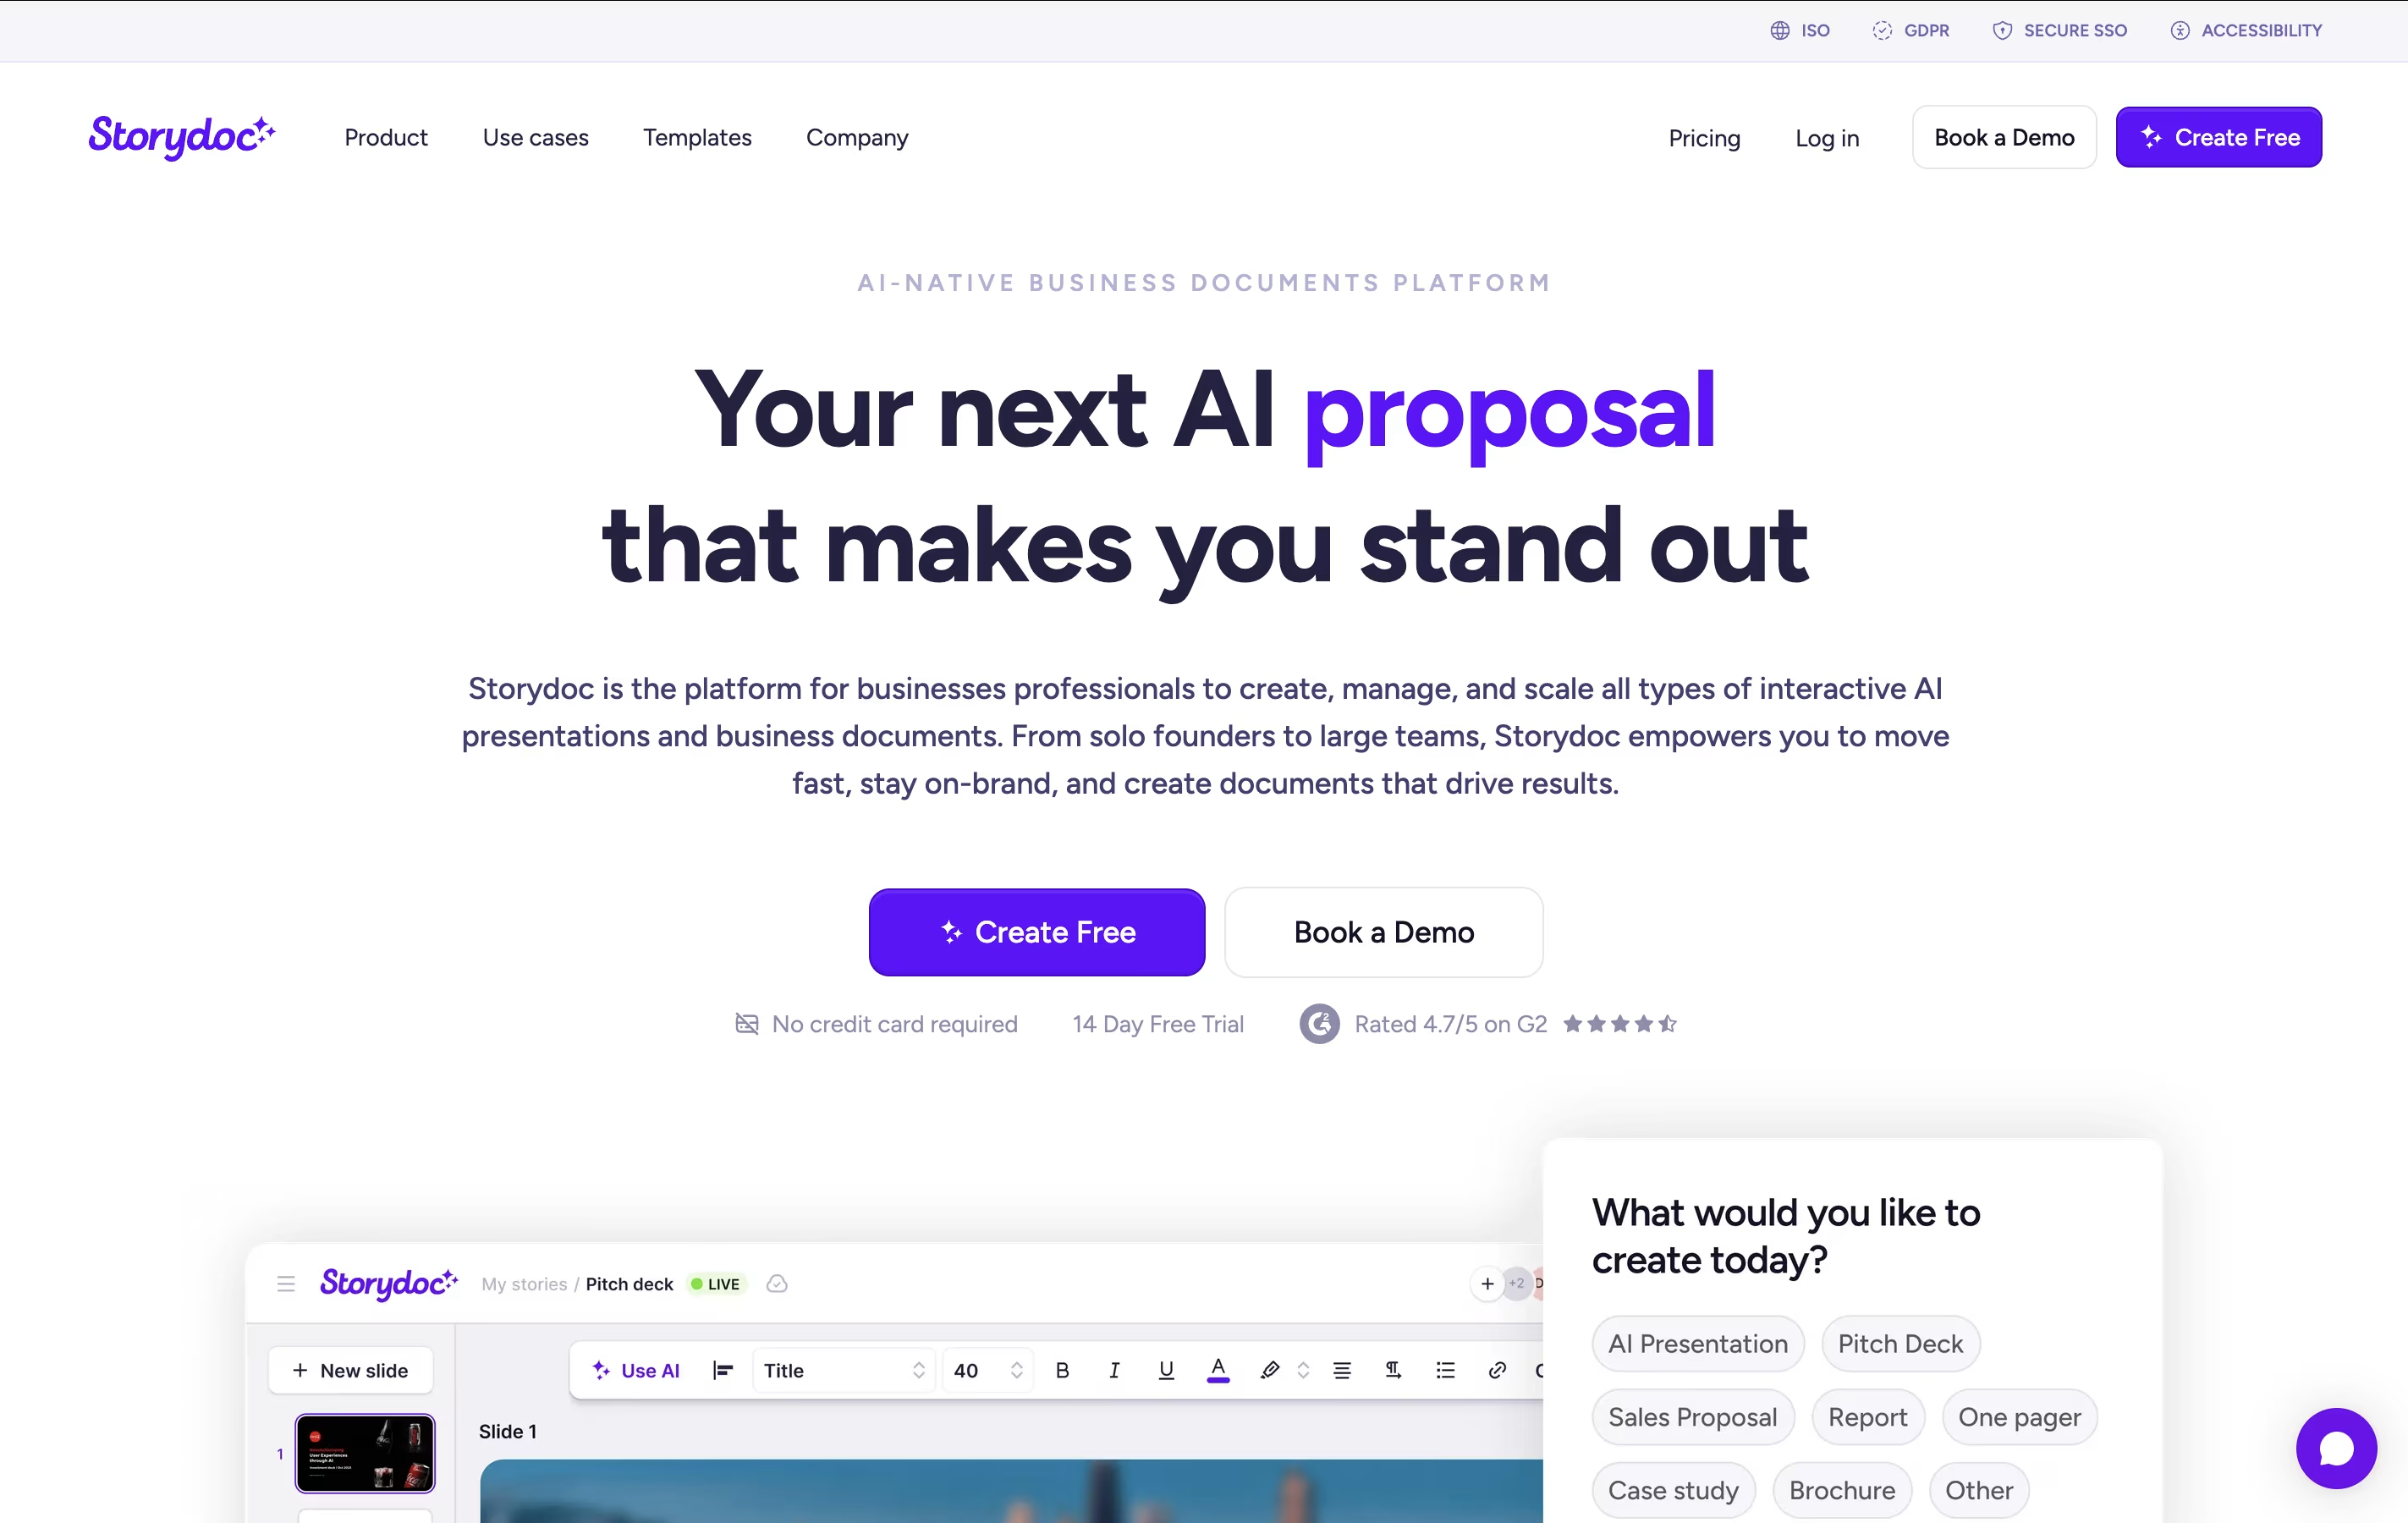
The platform combines artificial intelligence with smart design tools to help you create presentations that actually get results. It includes features like real-time analytics, CRM integration, and mobile optimization. You can embed videos, calendars, forms, and other interactive elements directly into your presentations.
Storydoc is designed for business professionals who need presentations that convert viewers into customers. Whether you're creating sales decks, pitch presentations, proposals, or reports, the tool helps you build content that stands out and drives action. It offers templates for different business needs and lets you personalize content for each viewer automatically.

Visme is an all-in-one visual design platform that helps you create professional presentations, infographics, reports, social media graphics, and over 30 other types of content. Unlike traditional design software that requires technical skills, Visme makes design accessible to everyone through its intuitive interface and extensive template library.
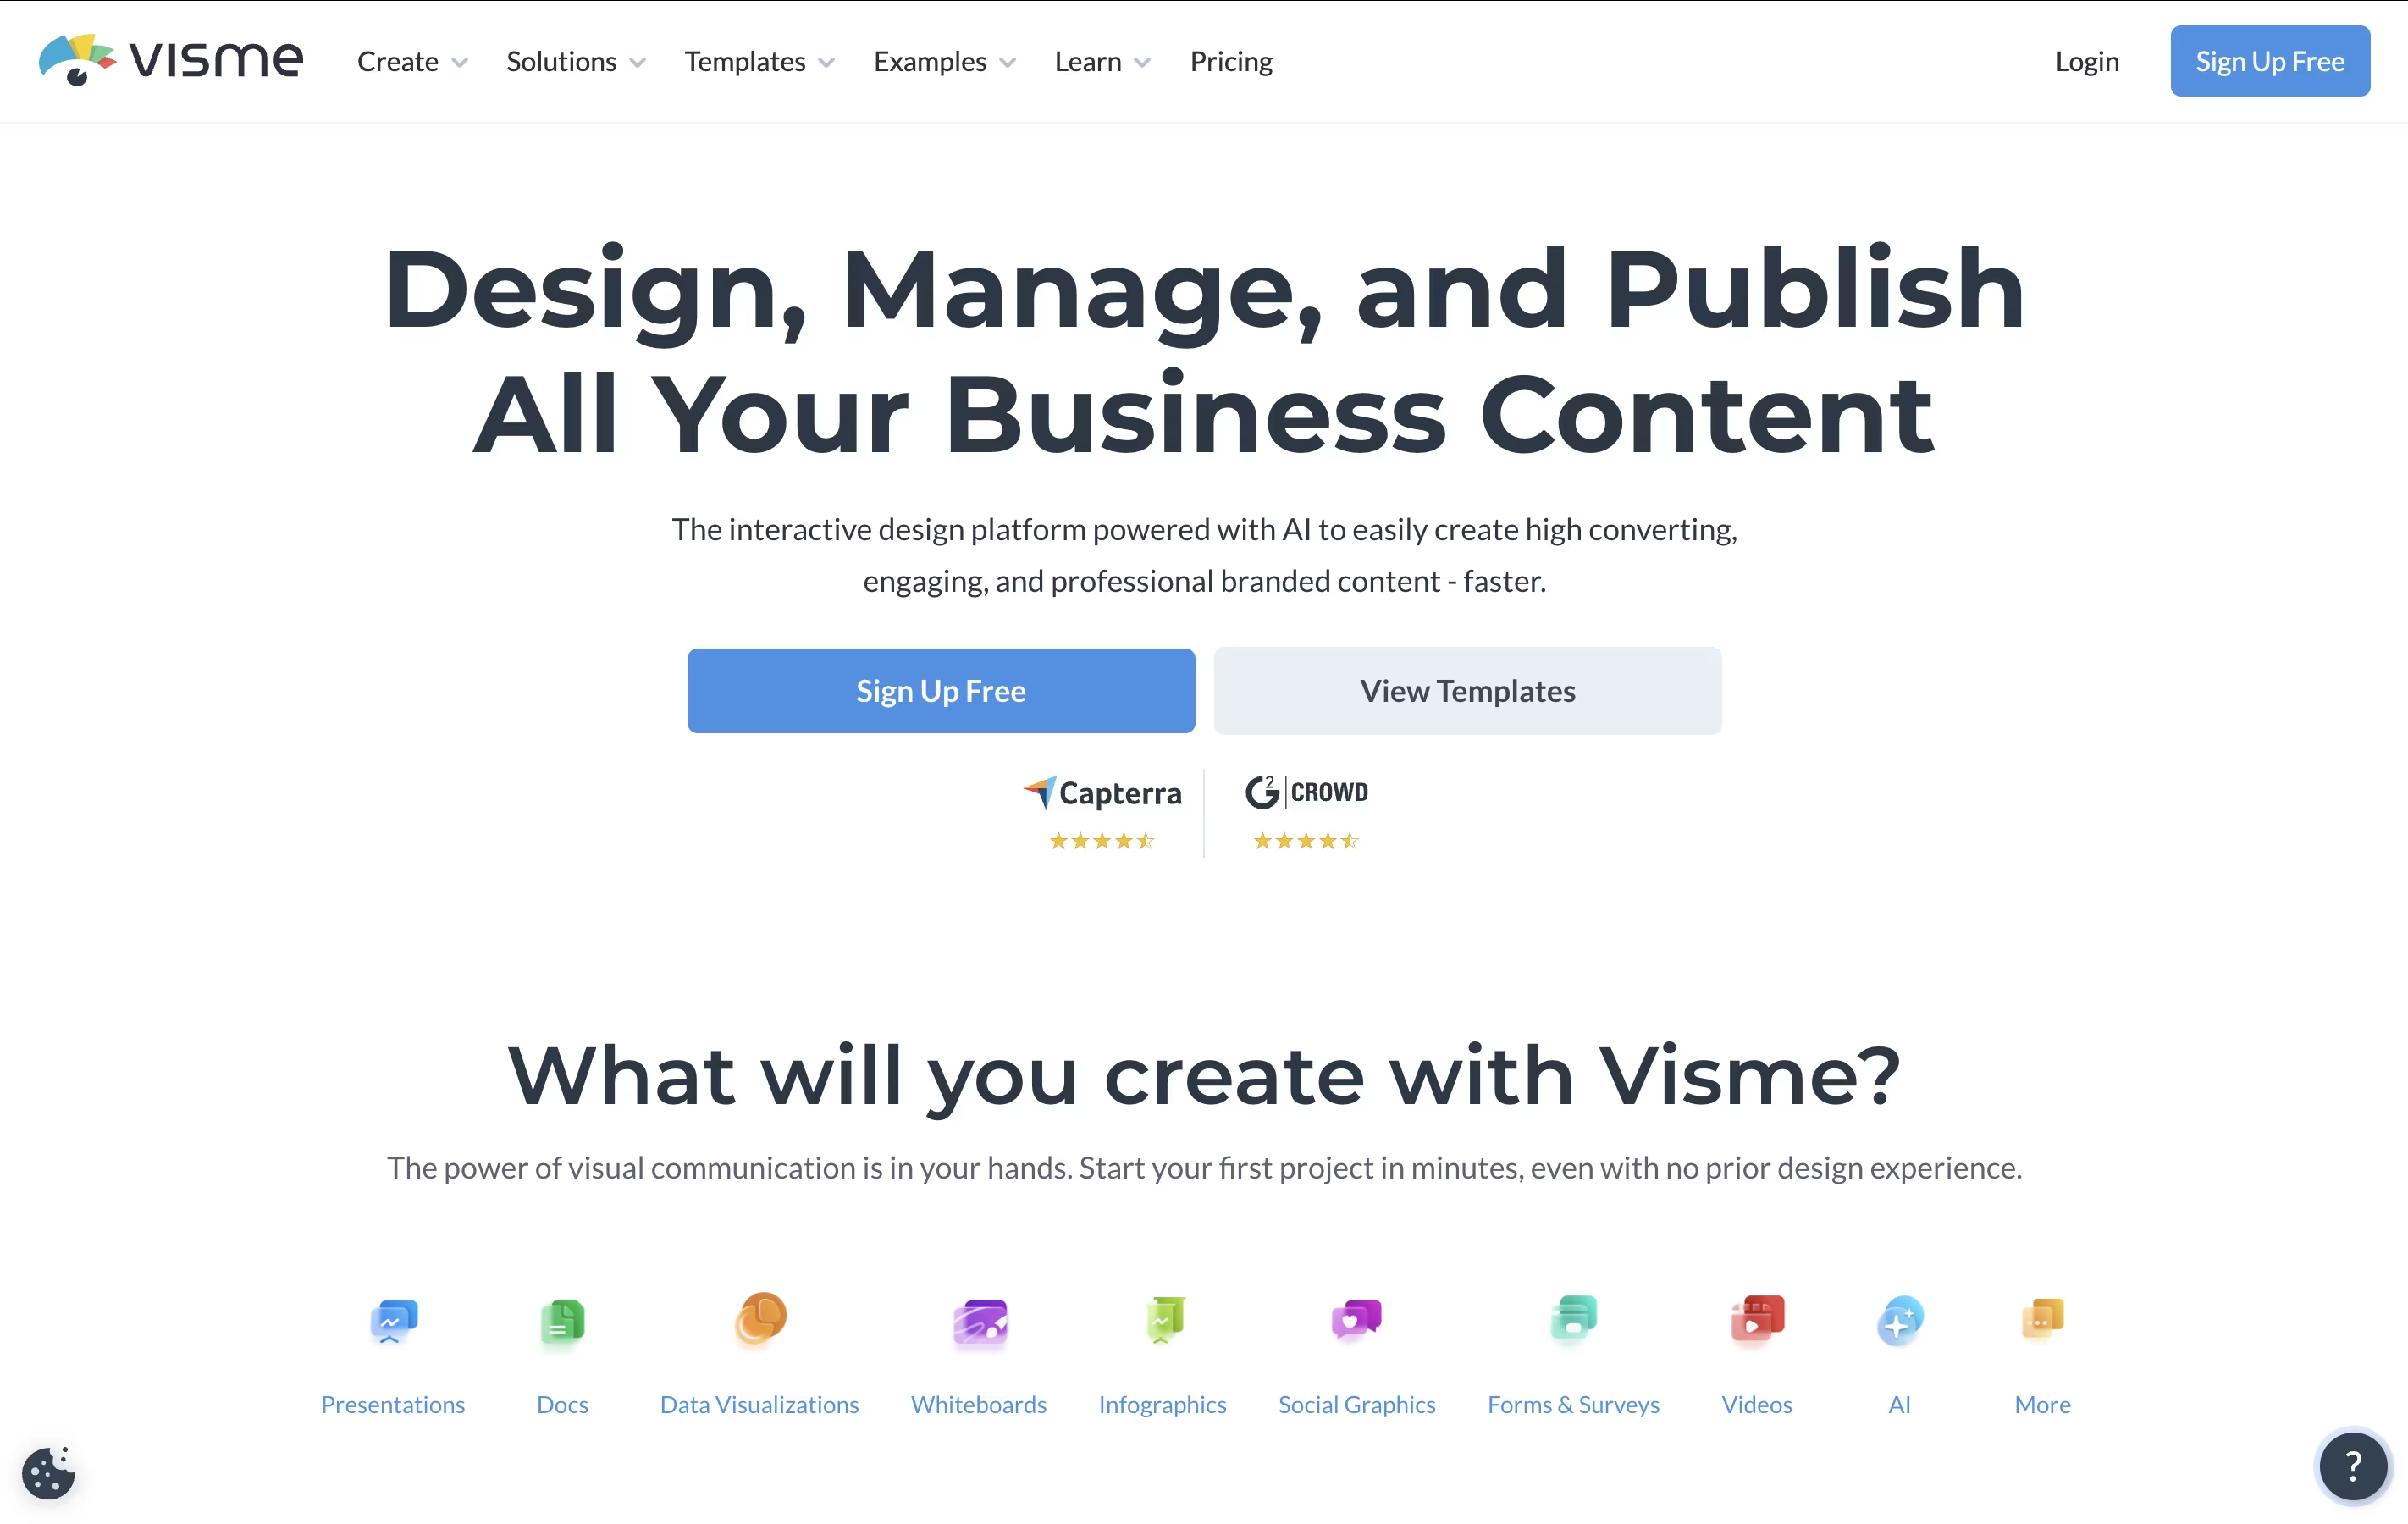
The platform offers thousands of customizable templates, drag-and-drop editing, interactive elements like animations and clickable links, and collaboration features for teams. It includes AI-powered tools that can generate designs from text prompts, making content creation even faster.
Visme works entirely online, so you don't need to download software. You can create content, share it with your team for feedback, and publish it directly from the platform. It's designed for businesses, educators, marketers, and anyone who needs to communicate ideas visually without hiring a designer.

Metabase is an open-source business intelligence platform designed to make data accessible to everyone in your organization. Instead of requiring SQL knowledge or technical training, it provides a visual query builder that lets users click and drag to create charts, graphs, and dashboards.
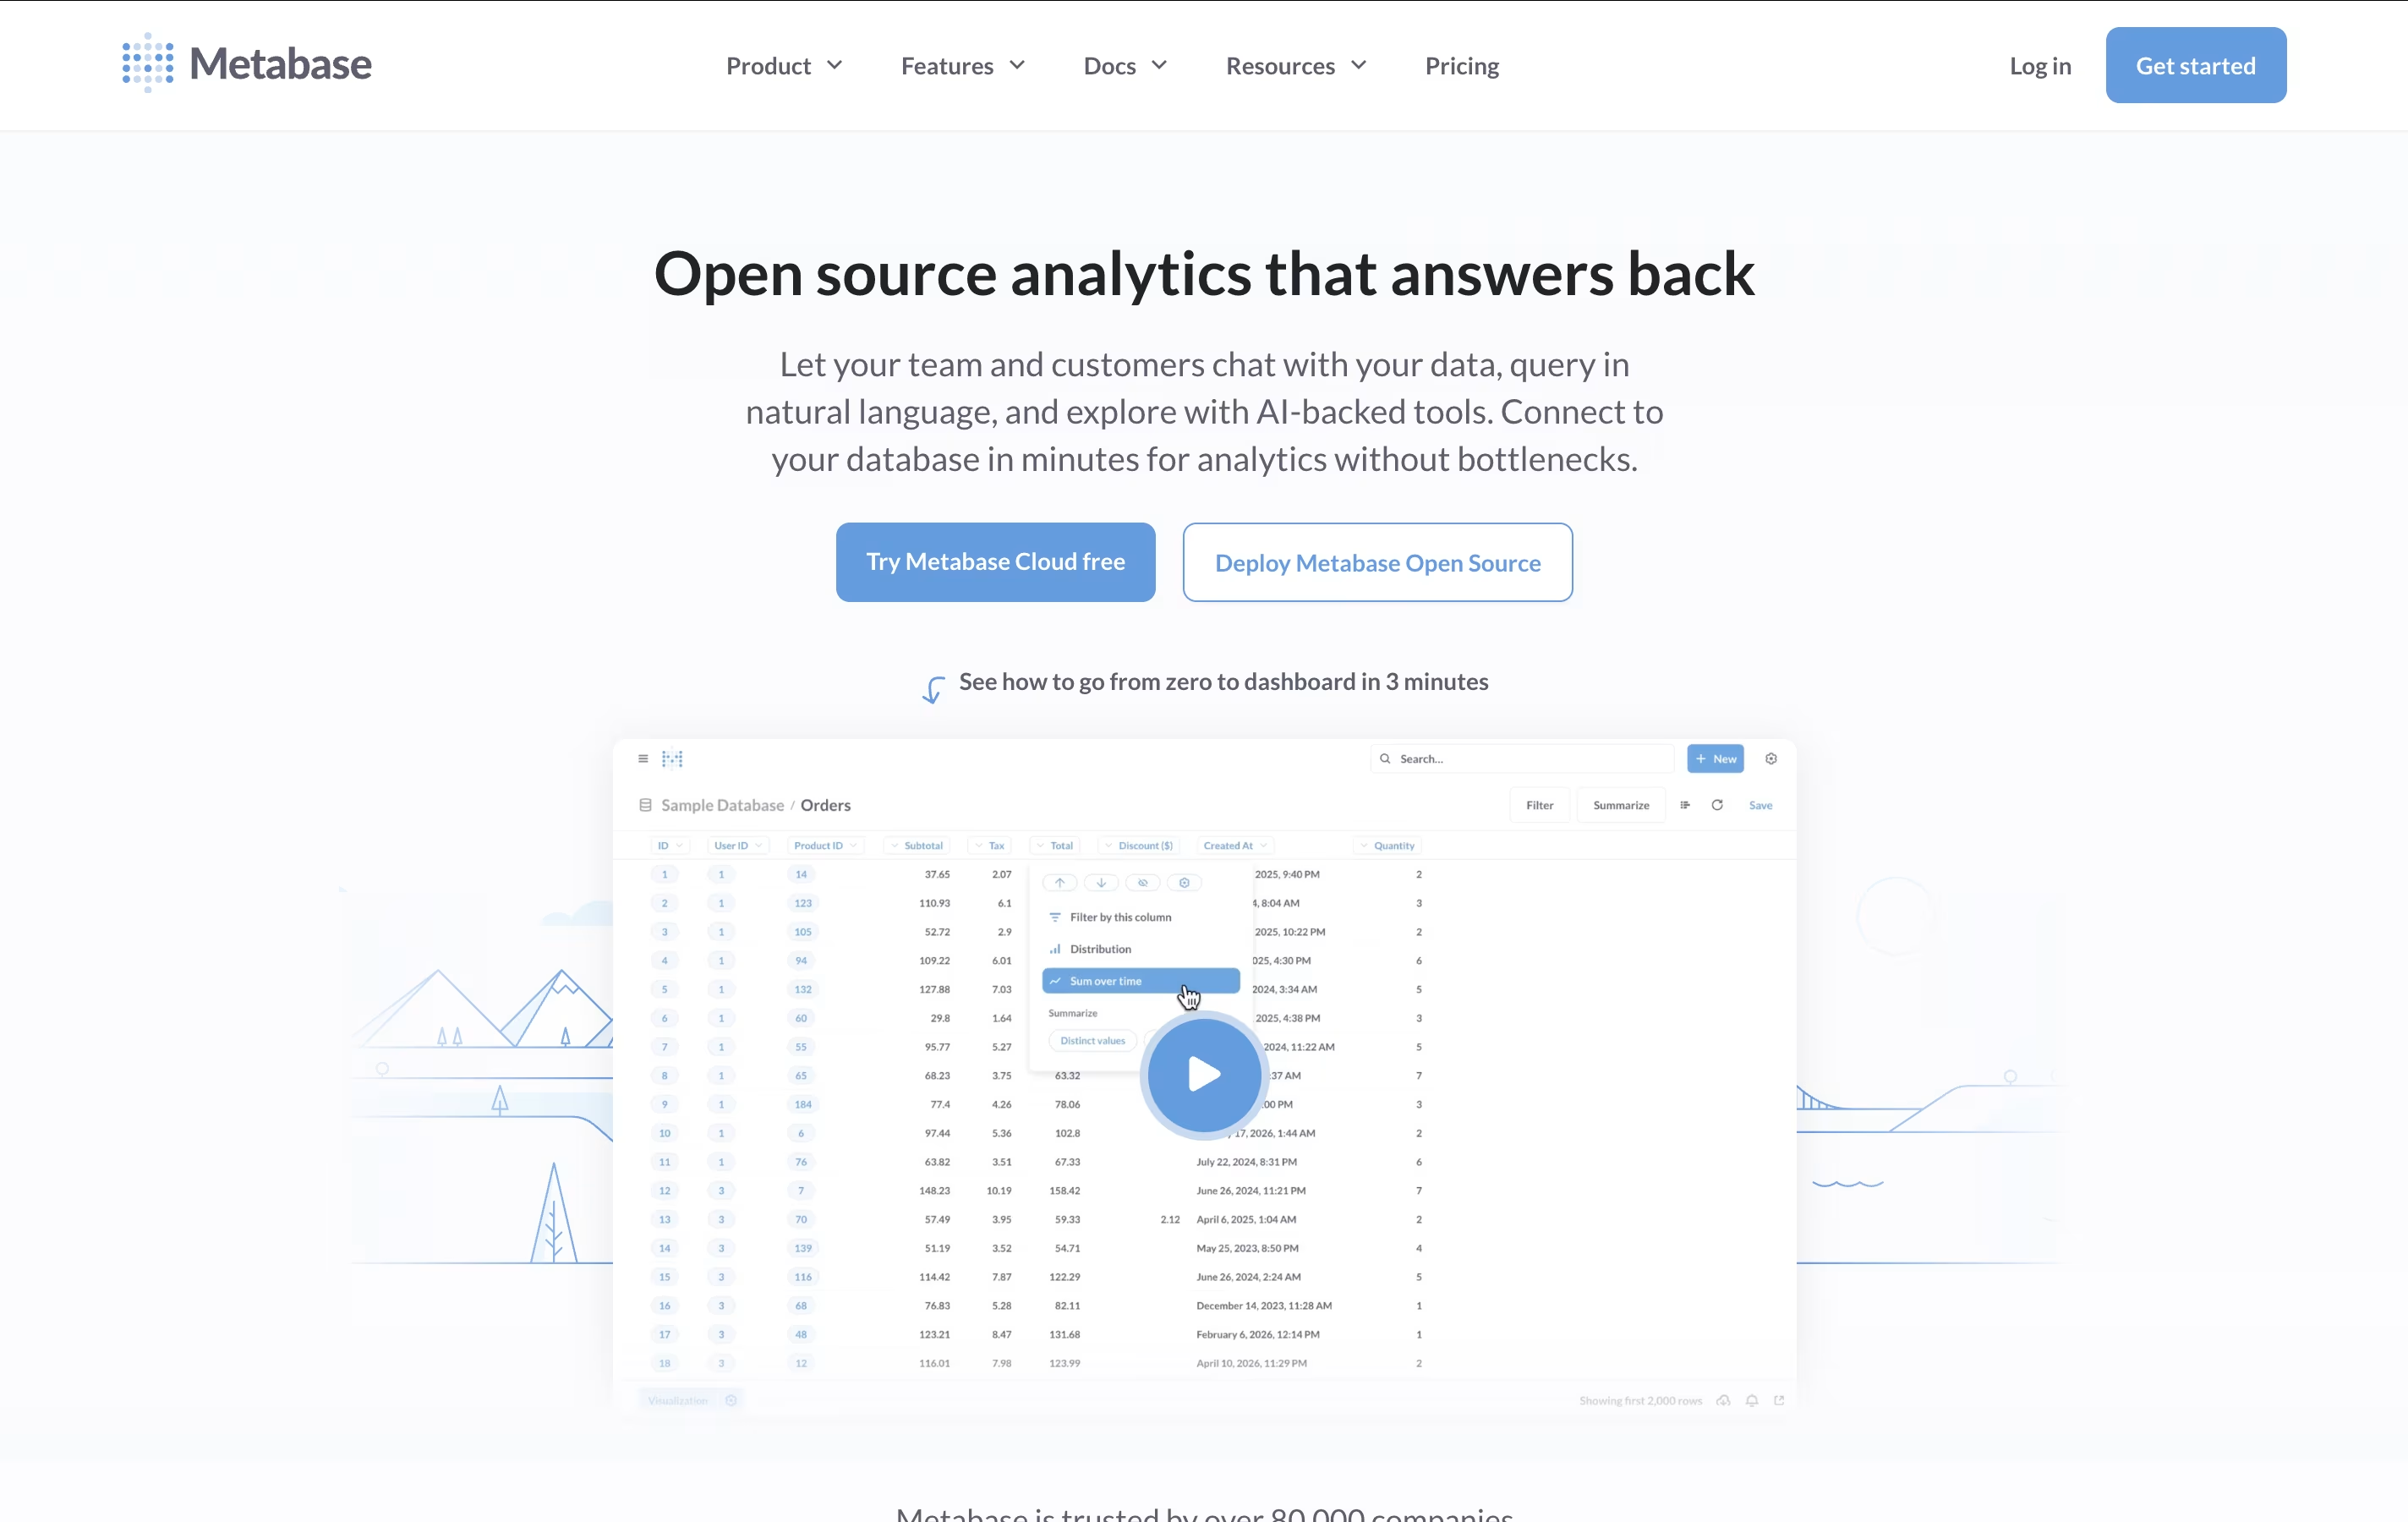
The platform connects to over 20 different databases and data sources, from PostgreSQL and MySQL to cloud services like BigQuery and Snowflake. It queries your data directly without copying or storing it elsewhere, which keeps everything secure and up-to-date.
Metabase offers both self-hosted and cloud deployment options. The open-source version includes all core features for free, while paid plans add advanced permissions, embedding capabilities, and professional support. Whether you're a startup analyzing customer data or an enterprise building internal dashboards, Metabase scales from simple charts to complex multi-user analytics platforms.

Confluence is an online workspace where teams create and share documents, project plans, and company knowledge. You can think of it as a shared notebook that your entire organization can access and update together.
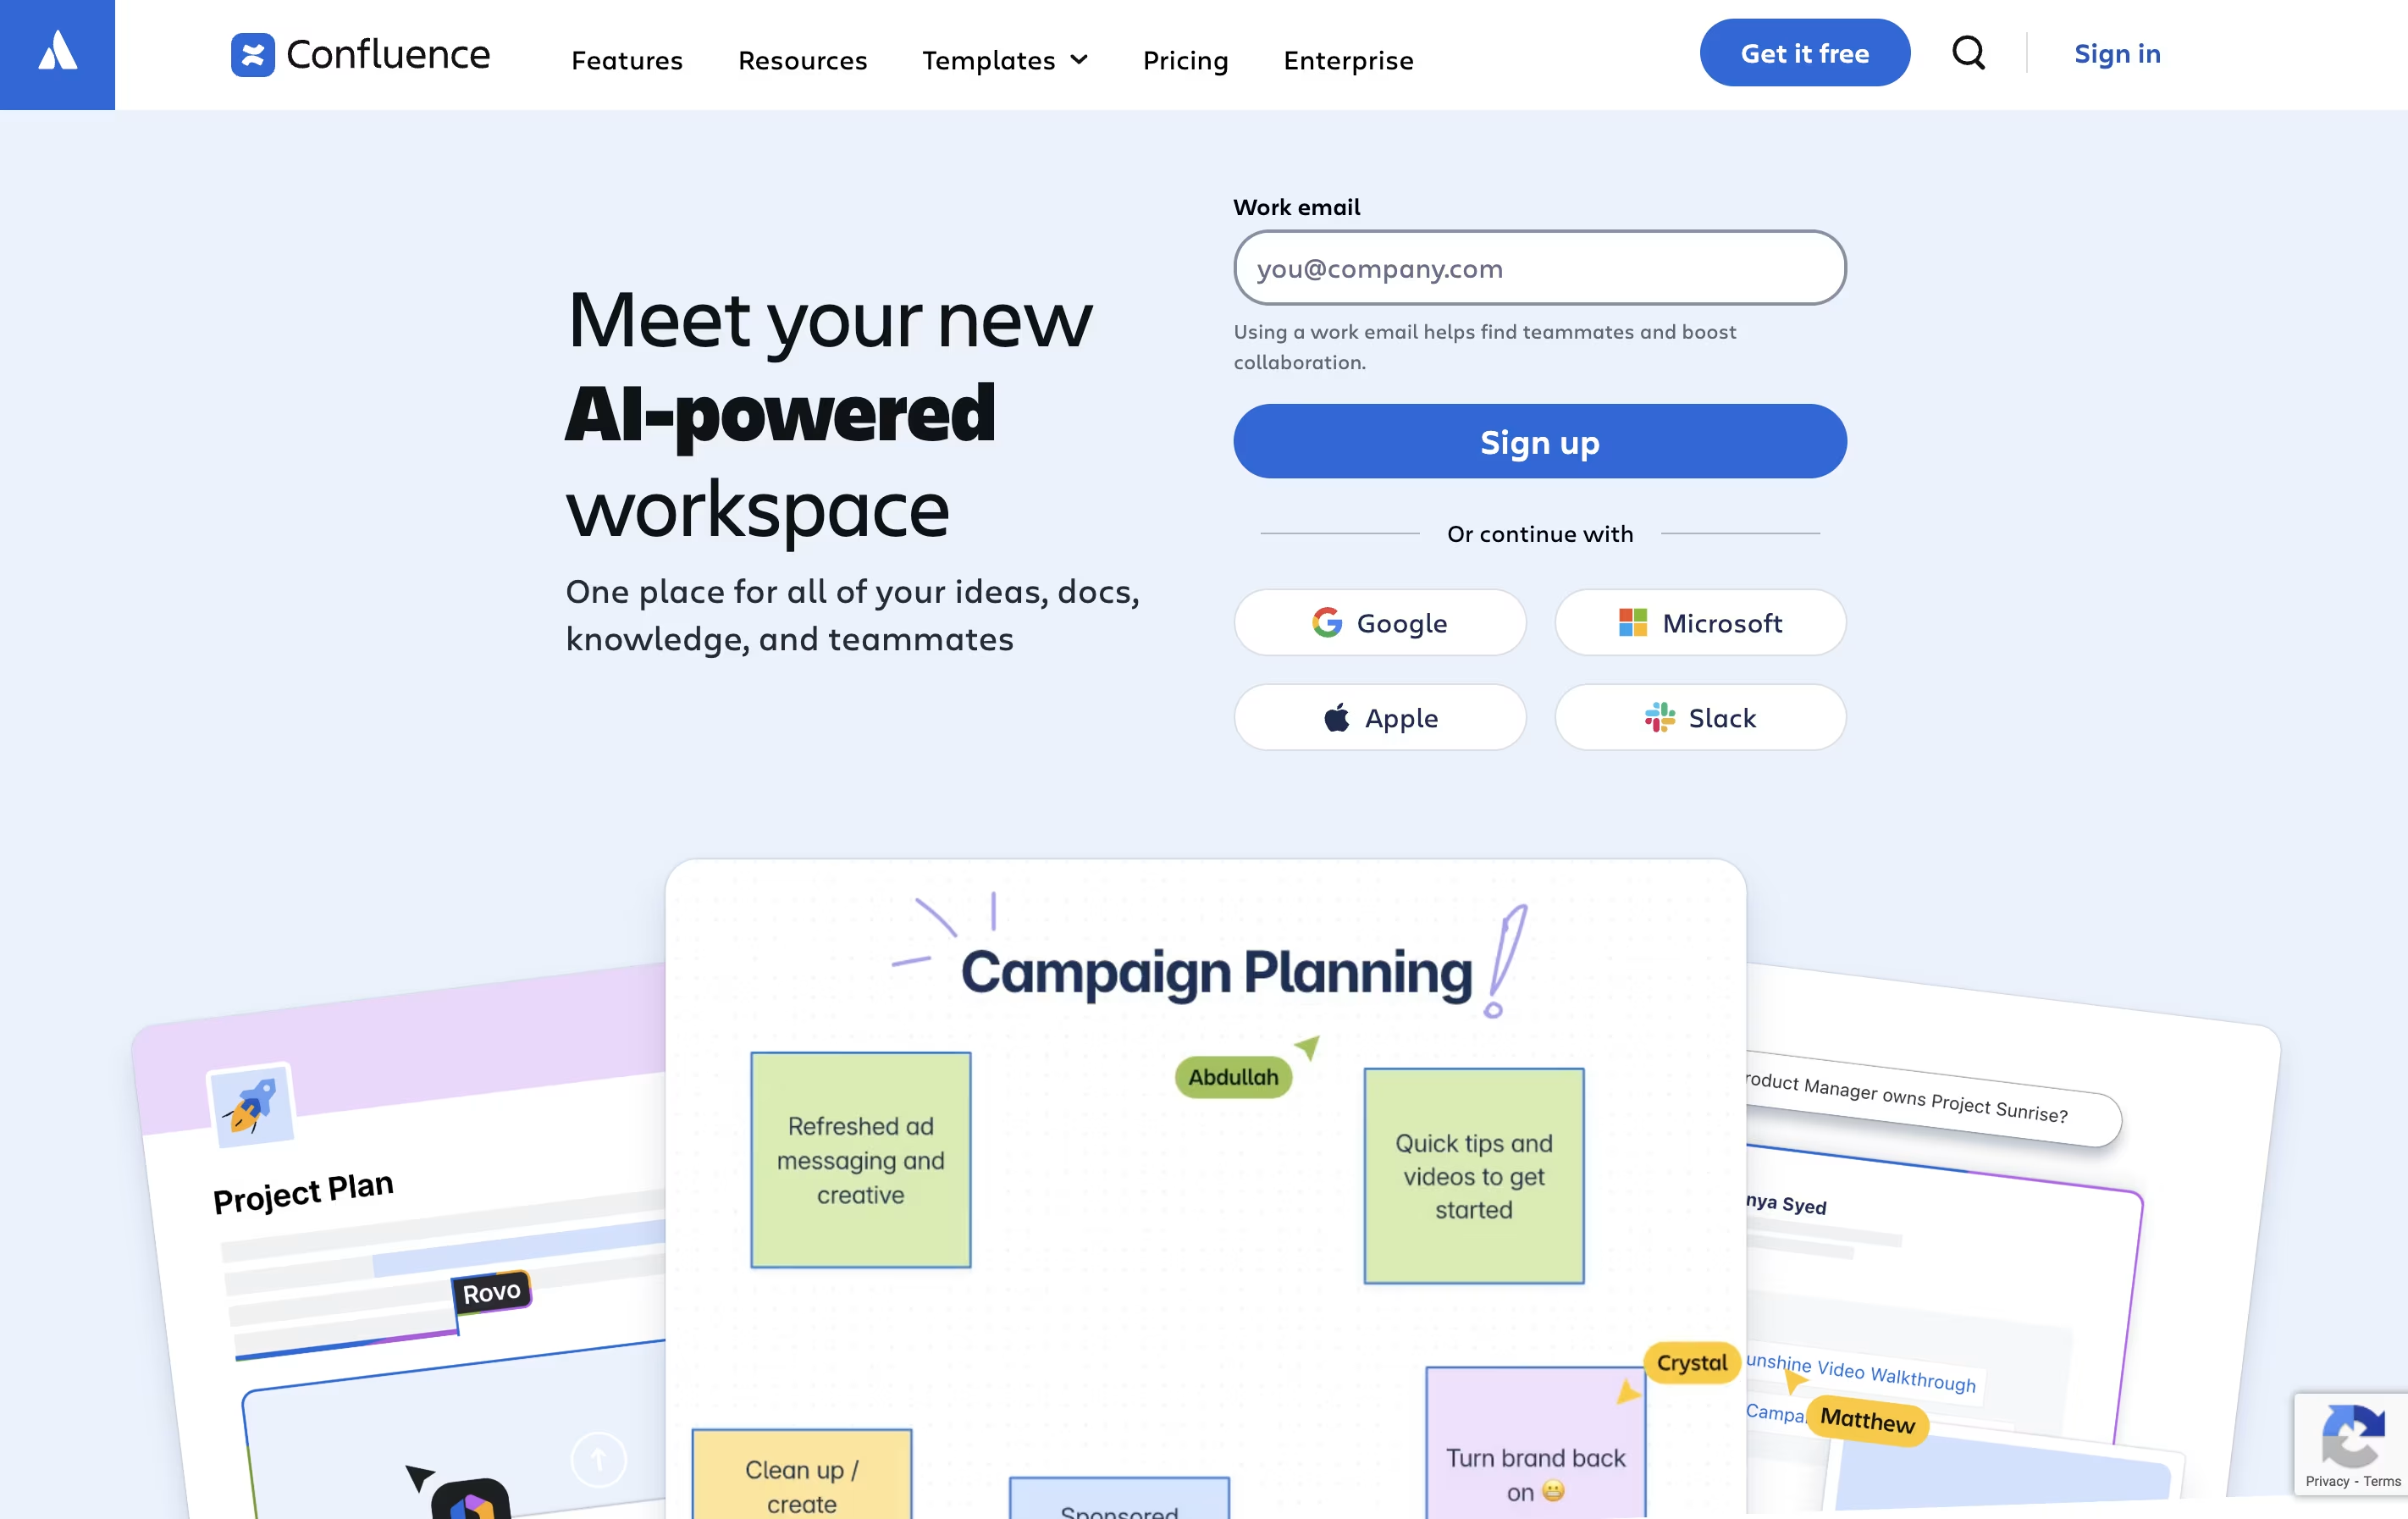
It works in your web browser or through mobile apps. You build pages using a simple editor that looks similar to Microsoft Word or Google Docs. These pages can include text, images, videos, and links to other tools. You organize pages into spaces for different teams or projects.
The platform includes whiteboards for brainstorming, databases for organizing information, and templates for common documents. With AI features built in, Confluence can summarize long pages, help you write content, and quickly find information across all your team's documents.

Cube.js is a universal semantic layer that sits between your data sources and applications. Think of it as a smart middleware that connects to data warehouses like Snowflake, BigQuery, or Postgres and transforms raw data into business-ready metrics and dimensions.
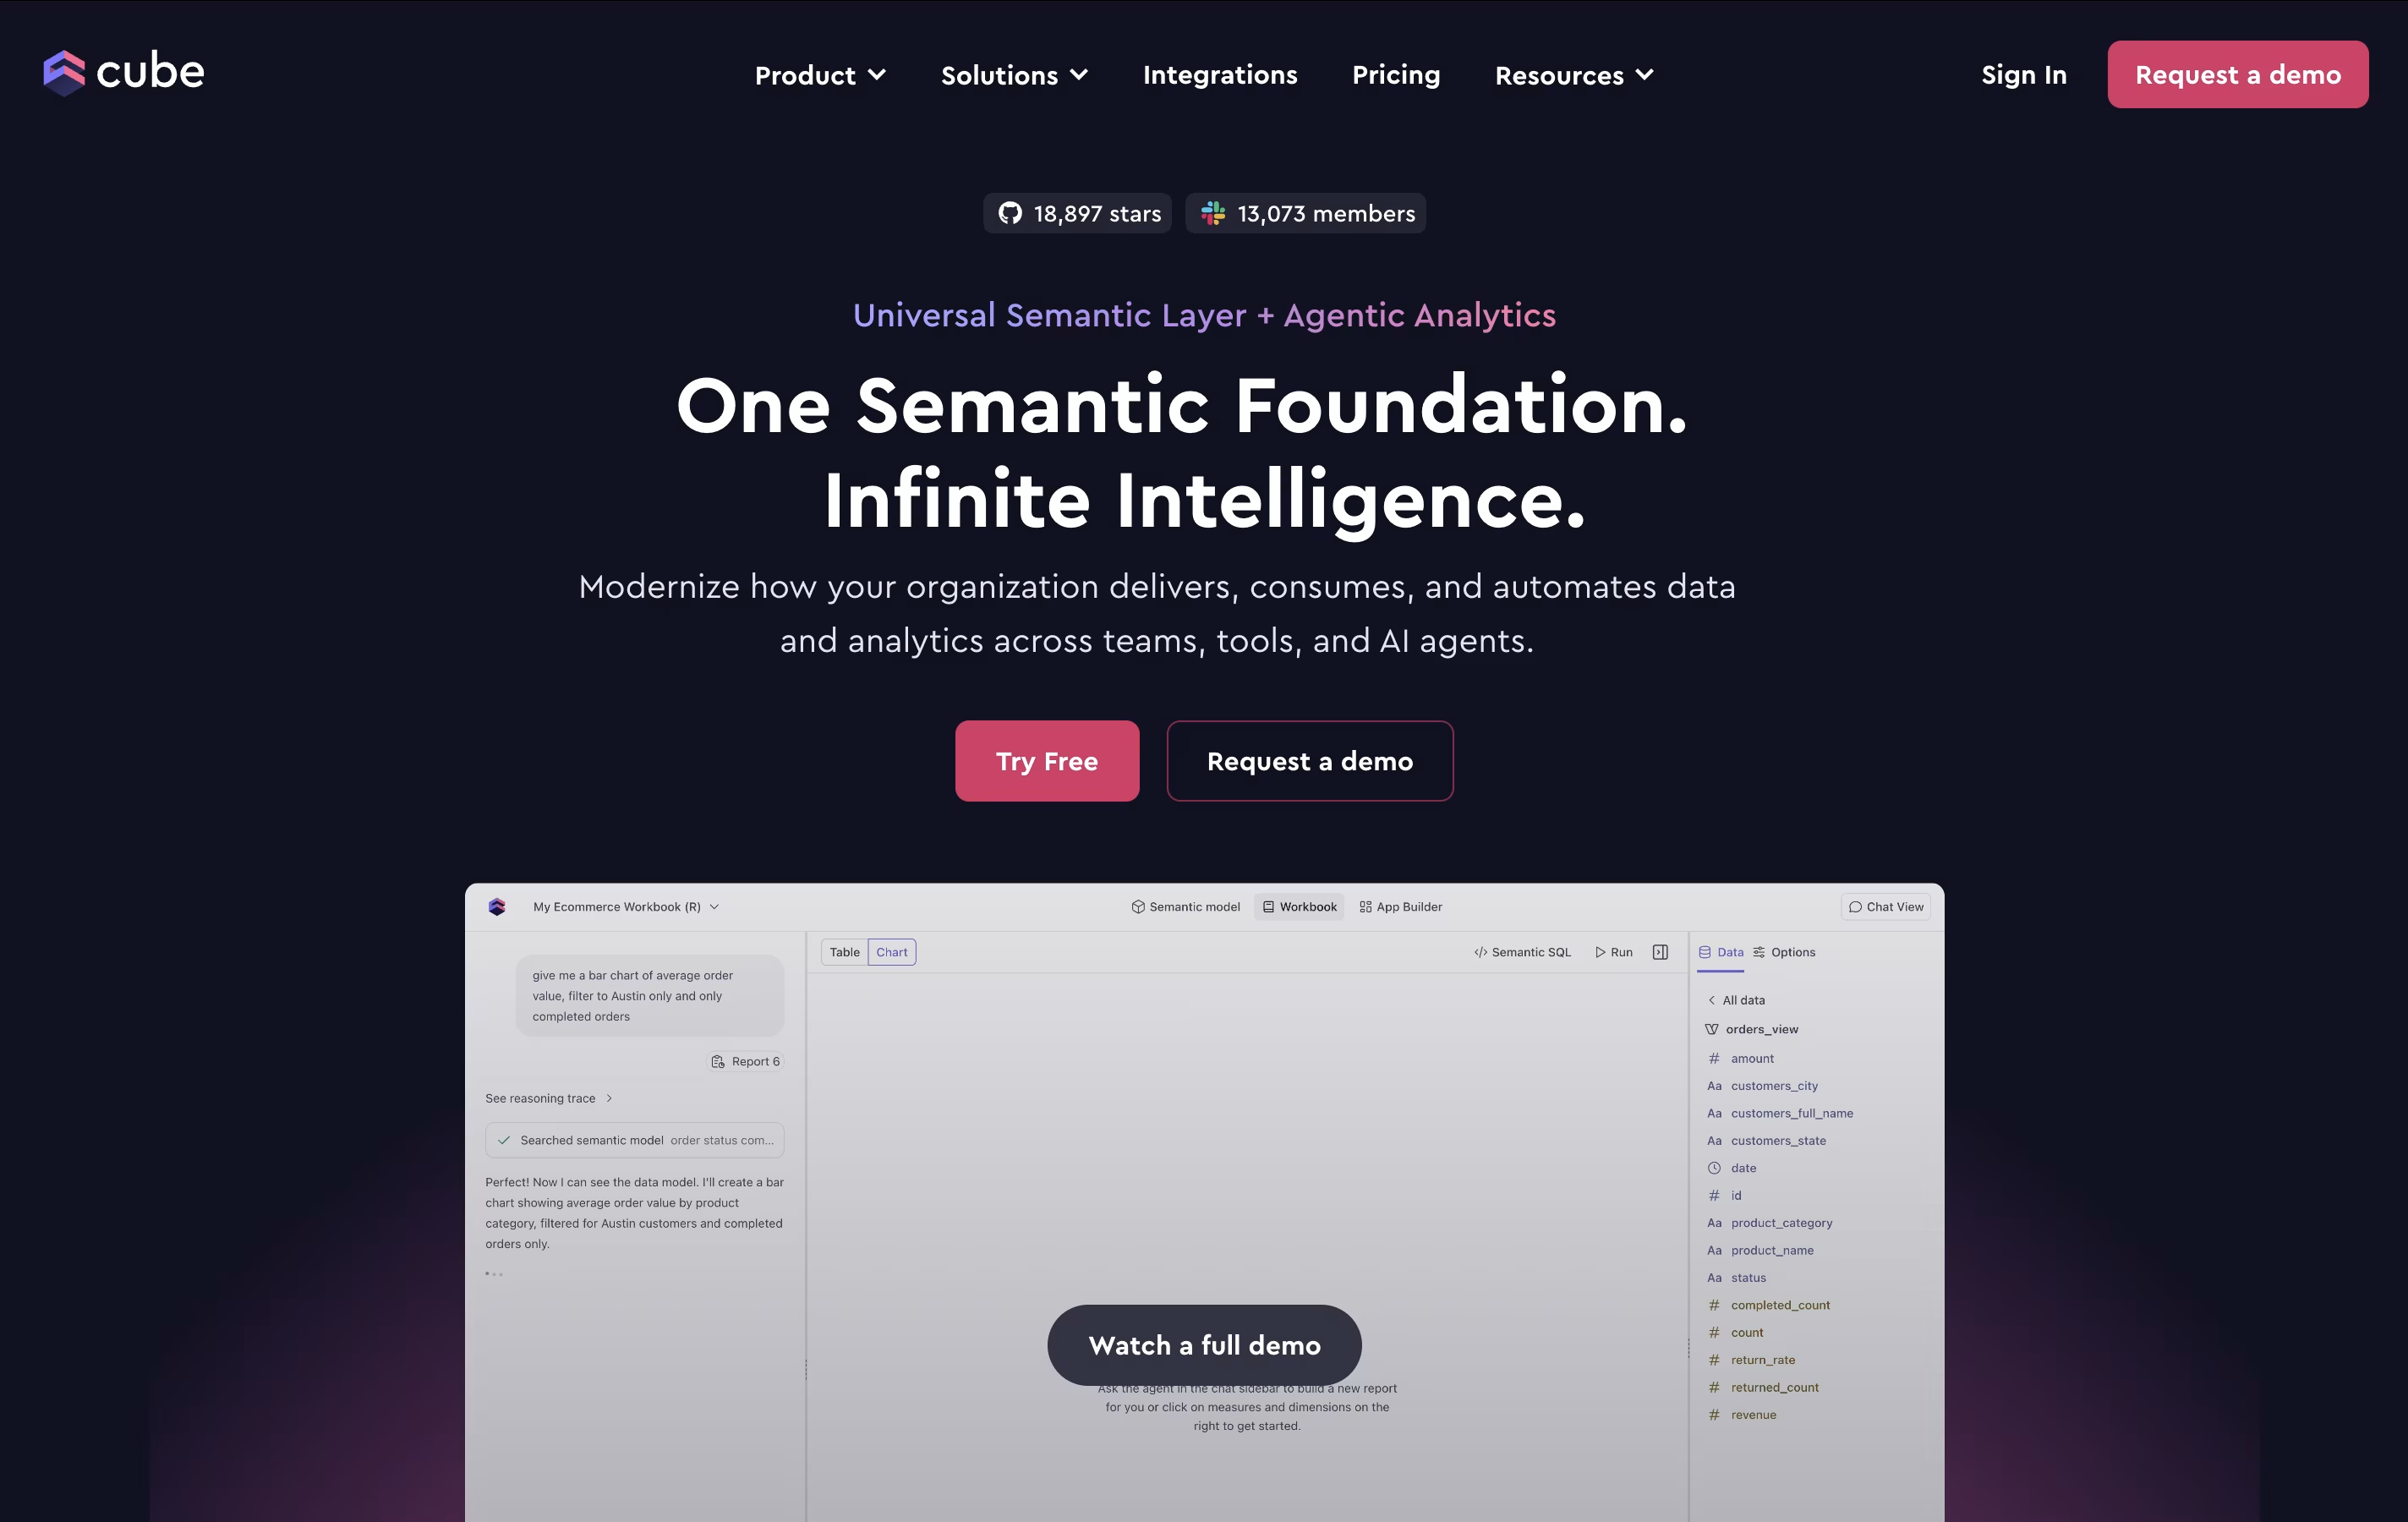
Unlike traditional BI tools that lock you into specific interfaces, Cube.js provides flexible APIs that work with any application or tool. You define your data model once using code, and Cube.js automatically generates optimized SQL queries, handles caching for faster performance, and provides consistent results across all your applications.
The platform consists of two main offerings: Cube Core (open-source) for self-hosting and Cube Cloud (managed service) with additional enterprise features. Both versions support the same core functionality but Cube Cloud includes hosting, security features, and integrations with popular BI tools like Tableau and Power BI.